As part of our “Technical Indicators Explained” series, we are focused on breaking down some of the more commonly used technical indicators that may be beneficial to your trading. There is an endless supply of different technical indicators and you should not attempt to use every single one of them. Instead, you should focus on the indicators that actually help improve your decision making process. When it comes to these indicators, less is more. One popular indicator that you may consider using is a stock’s RSI.
What it Is
The RSI, or Relative Strength Index, is a momentum indicator that compares price movement over time. This indicator, referred to as an oscillator, was initially developed by J. Welles Wilder in an attempt to measure whether a stock was overbought or oversold.
The Formula
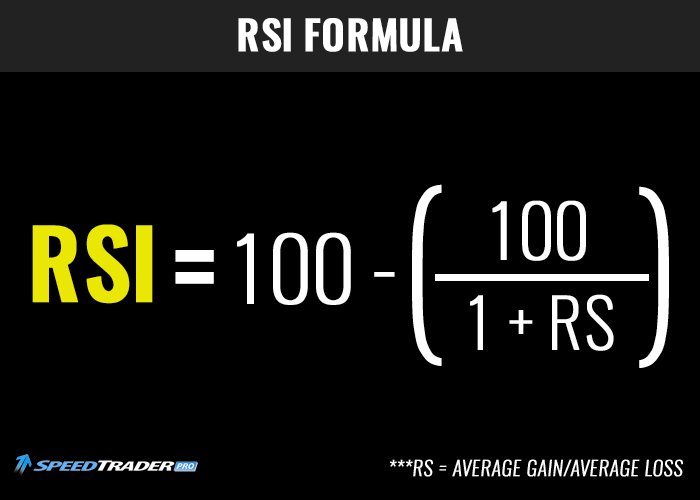
The formula for calculating the RSI is as follows:
RSI = 100 – (100/1+RS)
***RS = Average Gain/Average Loss
Most charting platforms will calculate the RSI for you, so there’s no need to memorize the formula. However, understanding the formula can help you better understand how this indicator works.
Generally, the RSI will be calculated for a 14-day period, however, you can choose custom settings in your charting platform if you’d like.
How it Works
The RSI can be helpful for pinpointing abnormal price action and higher volatility. For example, if a stock plummets out of nowhere, the RSI will indicate the stock as oversold. An oversold or overbought condition may be indicative of a future reversal. Of course, a stock’s plunge may be justified and oversold conditions do not guarantee a reversal.
Basic Rules
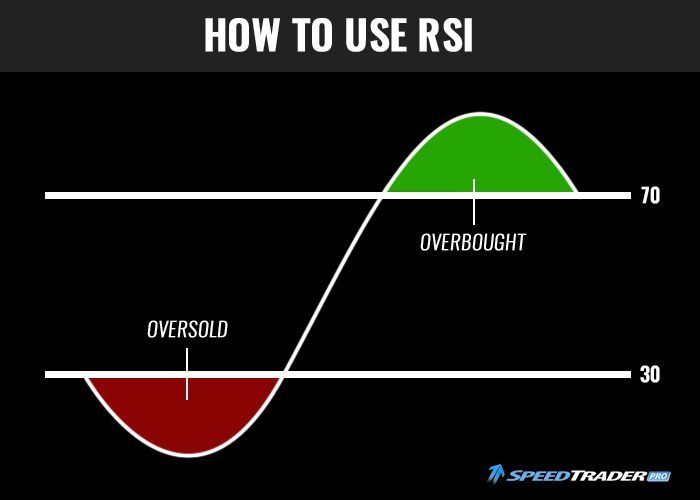
– The RSI will uses a scale of 1-100.
– When a stock is trading normally, its RSI will be in the range of 30 to 70.
– If the RSI goes above 70, the stock is considered to be overbought.
– If the RSI falls below 30, the stock is considered to be oversold.
If the RSI indicates that the stock is overbought, the stock may be overvalued, whereas if the RSI indicates that the stock is oversold, the stock may be undervalued.
Considerations
Fundamental Data – The RSI is based solely off of price action and does not account for fundamental data. For example, let’s say a stock has an RSI of 20. This would tell us that the stock is oversold, and therefore, potentially undervalued. However, the RSI doesn’t tell us why the RSI is that low. The RSI may have dropped that low due to a lack of interest in the stock, meaning the stock may be undervalued soon. Contrarily, the RSI may have dropped below 20 because the company lost a big contract and released poor earnings. In this case, the stock may not actually be undervalued.
Market Reaction – A stock does not need to reverse just because it is overbought or oversold. While the RSI can be an insightful indicator, there’s no guarantee that the market will react rationally. Even if a company is genuinely undervalued, it still may not reverse. Think of this in relation to consumer markets.
Hypothetically speaking, let’s say plasma televisions have been dropping in price for months, to the point where the price is far below fair market value. While it could be argued that plasma televisions are undervalued, consumers may just prefer LCD televisions. In this case, plasma televisions may never generate higher demand in the future, meaning they can stay undervalued for an indefinite period of time. Relating this back to stocks, the market may not care that a company is undervalued. Remember, stock prices are determined by supply/demand levels, and although company fundamentals may play a role in the valuation, the market still has the final say.
Applying the Data
Overbought/Oversold
The main use of the RSI indicator is to determine whether a stock is overbought or oversold. This data can be applied in many ways. An investor may use the RSI on a daily chart to buy stocks when they are undervalued, a swing trader may use the RSI on an hourly chart to wait for a stock to pullback before entering a trade, and a day trader may reference oversold RSI conditions to initiate a short position.
A quick glance at the RSI can provide a lot of valuable data for assessing the buying activity of a stock.
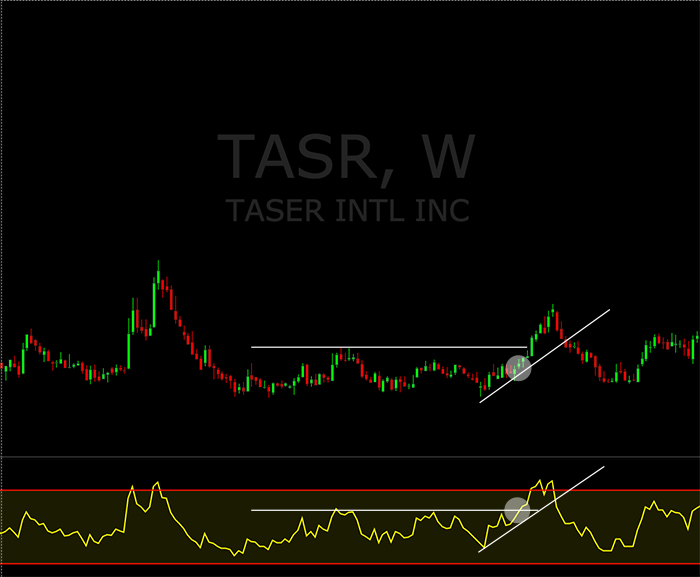
Trend lines
You can draw trend lines for the RSI indicator just as you would for a normal stock chart. RSI trend line breaks may indicate a reversal.
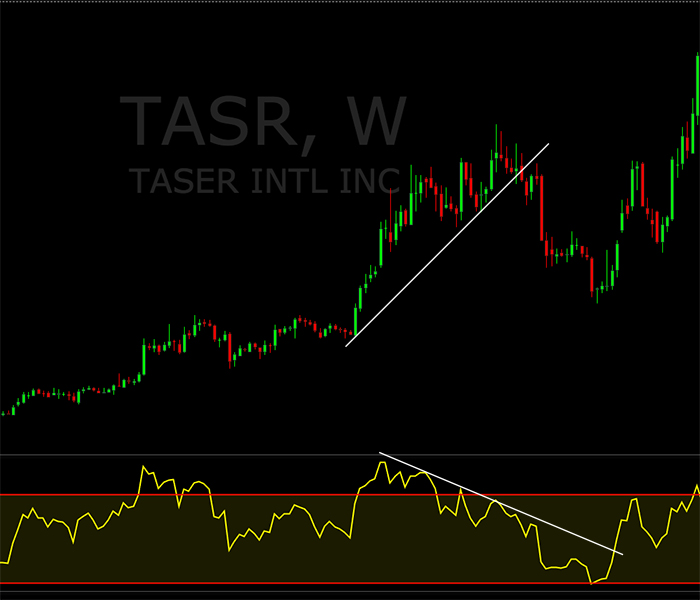
Divergences
When the RSI’s trend line moves in the opposite direction of the underlying stock’s trend line, a reversal may be near. For example, if the RSI is down trending while the stock is up trending, this may be a signal for a future reversal.