

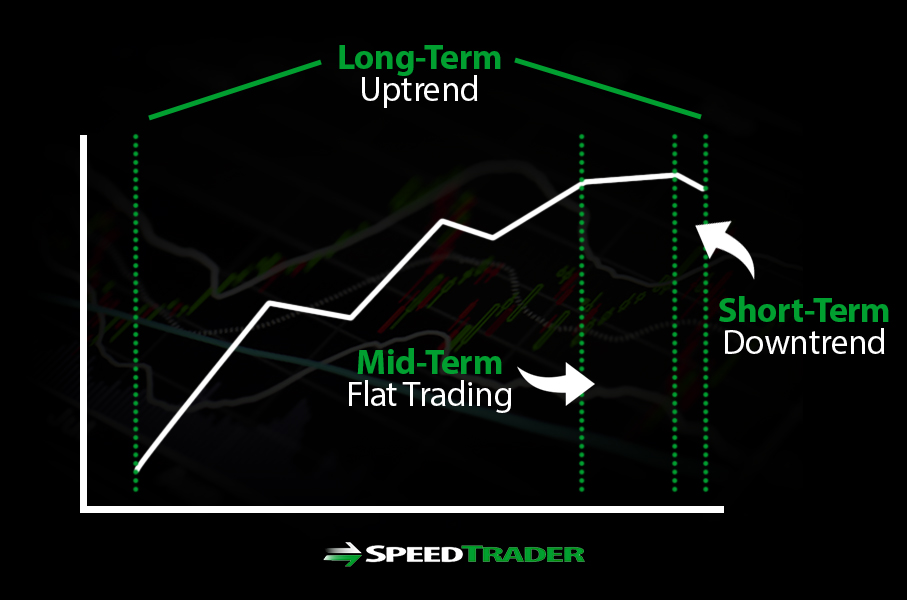
Why Multiple Time Frames?
It can be very confusing when an investor sees a stock that is up trending, while a day trader clearly sees a downtrend at the same time. A stock (or any financial instrument) can absolutely be up trending and downtrending simultaneously. This is because each trader may be segmenting his or her view on different time frame charts, specifically for their trading/investing objective. Using multiple time frame charts allows one to have a greater perspective on the underlying price action. This is akin to a meteorologist viewing local (neighborhood), regional (multiple states) and national (country wide) weather conditions. The weatherman may forecast heavy storms on a regional level, but it may be bright and sunny outside your front door. However, it would be prudent to prepare for the heavy thunderstorms that are eventually coming. This is exactly how a stock can be in a current short-term up trend within in a longer-term downtrend.
Different Time Frames For Different Participants
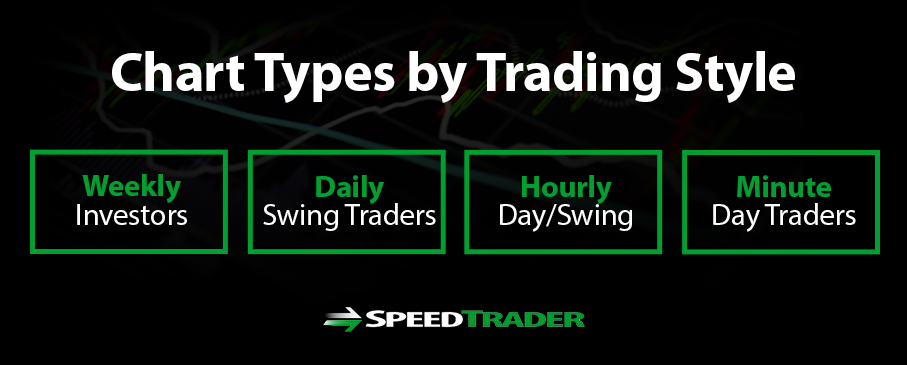
The time frames that are suitable to for you can be determined by your objective and style. Traditionally, there are four commonly used types of time frames, weekly, daily, hourly and minutes.
Weekly times frames are best suited for passive long-term investors and longer-term swing traders with a time span of months to years.
Daily time frames are suited for swing traders
Hourly time frames are suited for day traders and short-term swing traders.
Minute time frames are suite for active day traders
The Importance of Multiple Time Frames
By utilizing a multiple time frame approach, a trader attains the better perspective of the playing field. Most importantly, it provides the stronger support and resistance levels that may be virtually invisible on a shorter time frame chart.
Understanding Significant Price Points
For example a daily 200-period moving average may not show up on a 5-minute chart but is a very significant support/resistance that the stock may be constantly deflecting off. Knowledge is one of the trader’s most powerful weapons. Finding a reason for why a particular price level just can’t break is not only important, but finding out quickly is of the utmost important so that the trader can react ahead of others. It is always important to be aware of the daily and weekly 50-period and 200-period moving averages for your stocks. Most of the times, they may not be anywhere the stock is currently trading, however, when they are trading near those levels, the impact can be significant.
Understanding the Bigger Picture
When multiple larger time frames are in a trend, then the shorter time frames can be played on a counter trend reversion basis but ultimately, to trade in the direction of the larger trend is most prudent. Larger time frames should be used to gauge the trend, and the support and resistance areas. These can be the 50-period, 200-period moving averages as well as 5-period and 15-period moving average, which tend to be much more actively tested. What may appear to be a 5-period moving average support on a 1-minute chart may only be pennies away from a daily 200-period moving average resistance on the daily chart. In this instance, a prudent trader may short-sell into the daily 200-period moving average since it’s a stronger resistance versus a 1-minute time frame support. The longer time frames usually override the smaller time frame support and resistance levels and can be used to trade reversion and trend extensions when they come into play.
Understanding How Other Traders May Be Approaching the Trade
In trading, the objective is to spot and react to transparency before it becomes too transparent. Seasoned traders try to game the reactions of other traders. This is how the minus sum game of trading plays out. When you an spot a multiple time frame resistance, then you can look to sell your long position or short-sell just ahead of the resistance in anticipation of a reversion.