
Candlestick patterns are special on-chart candle formations, which hint at potential price outcomes. They can be found on the chart of any financial instrument – Forex, Stocks, Commodities, Indices, etc. Therefore, traders carefully follow every candle on the chart during the trading sessions. Today we will meet you with the 5 popular candlestick patterns, which are among the most traded formations on the chart.
Hammer and Shooting Star
The Hammer and the Shooting Star candlesticks are single candle formations on the chart. They have reversal character and tend to hint about a change in price direction.
The Hammer candle has a small body, a short upper candlewick and a long lower candlewick. In this manner, the candle really looks like a hammer on the chart. The Hammer candle could be found at the end of a bearish move implying that the price direction is about to switch.
As you could probably guess, the Shooting Star candlestick is a mirror image of the Hammer candle. It has a small body, a short lower candlewick and a long upper candlewick. This is why the candle is called “Shooting Star” – because it really looks like one. The Shooting Star candle could be found at the end of a bullish price move, speaking about a potential reversal. The image below will show you how do the Hammer and the Shooting Star candles work in trading.
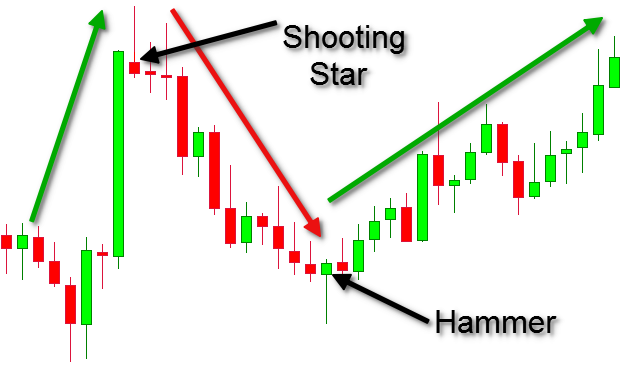
The image above shows you the way the price could reverse after a Shooting Star and a Hammer. The chart starts with a sharp price increase followed by a Shooting Star candlestick. This implies that the price might start a decrease. As you see, right after the candle is completed, the price starts a sharp decrease.
At the end of the bearish tendency we see a Hammer candle. Now we have the opposite scenario. We get a bullish confirmation when the candle is completed. This way, we have an opportunity for a long position. As you see, the price starts increasing after the Hammer candle is confirmed on the chart.
Doji
If you are familiar with the Doji candle, you can never confuse it on the chart. This is so, because the candle is very specific. When the price opens a candle at a certain level, and then closes the same candle at the same level, we get a Doji candlestick. In this manner, the candle has a body, which looks like a dash. The Doji has few variations depending on the size of its candlewicks – Neutral, Long-Legged, Gravestone, and Dragonfly.
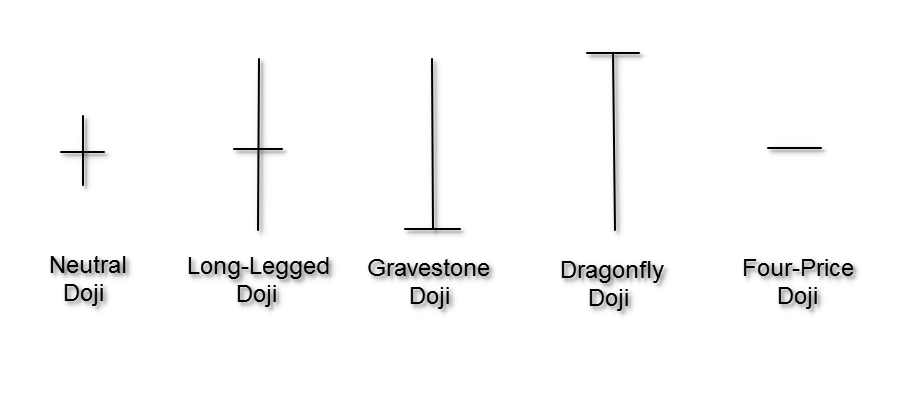
These are the four Doji candlestick types you can meet on the chart. However, despite of its four different types, the Doji candle has only one meaning on the chart – reversal. When we spot a Doji after a price increase, we expect a bearish move. When we identify a Doji after a bearish trend, we await for an upcoming price increase. Since you are now familiar with the Doji variations and its character, let’s now approach a real Doji example on the chart.
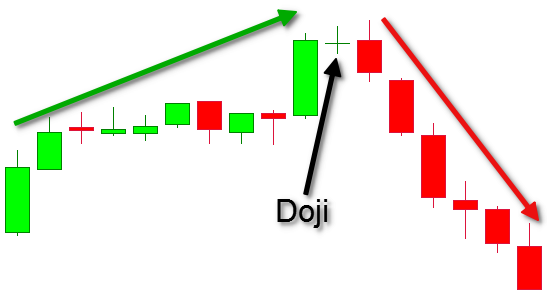
The chart stats with a price increase. Suddenly, a neutral Doji candle appears on the chart. This gives us a signal that the trend might be about to switch. The next six candles on the chart are bearish and relatively big.
Bullish and Bearish Engulfing
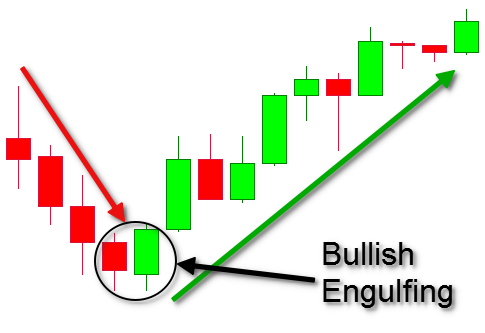
The Engulfing pattern on the chart is a double candlestick formation. This means that it is formed by two candles. We have an engulfing when a candle is fully covered (engulfed) by the body of the next candle.
The Bullish Engulfing consists of a bearish candle, followed by a bullish candle which gaps down and closes higher than the opening of the first candle. When we spot a Bullish Engulfing on the chart, we expect the price to start increasing.
The Bearish Engulfing is opposite to the Bullish Engulfing. It starts with a bullish candle, which is engulfed by a bigger bearish candle. After a Bearish Engulfing we expect a price decrease as shown on the image below.
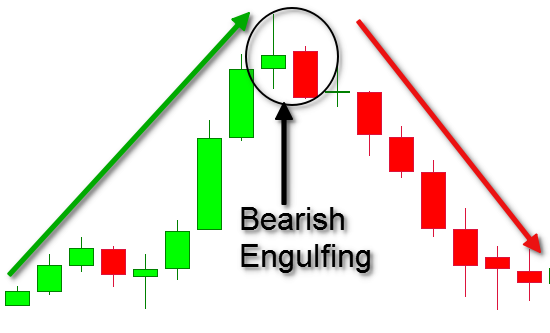
The confirmation of this candle pattern comes with the end of the second candle. When you spot a Bullish Engulfing on the chart, you get an alert that the buyers might be picking up versus the sellers. The opposite is in force for the Bearish Engulfing.
Dark Cloud Cover
The Dark Cloud Cover is another double candle formation. The first requirement of the Dark Cloud is to have a big bullish candle on the chart. The next candle should gap up and should be bearish. At the same time, it should close below the midpoint of the first candle’s body. The image below will make that clear for you.
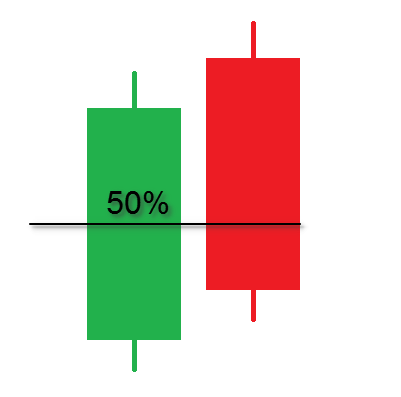
The second candle on the image gaps up from the close of the first candle. Then the second candle closes below the midpoint of the first candle. This confirms the Dark Cloud Cover candle pattern. After a Dark Cloud Cover, we expect the price to drop as shown on the image below.
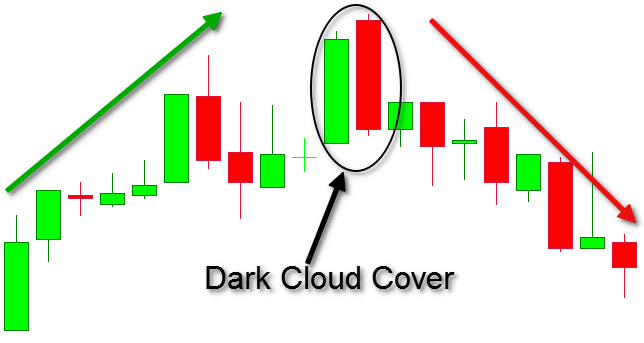
On this image you see that the price is increasing initially. Suddenly, the price action forms a Dark Cloud Cover, followed by a price decrease.
Bullish and Bearish Harami
Some people confuse the Harami with the Engulfing patterns. The Harami pattern is another double candle formation, where the second candle is engulfed by the first candle. There are two types of Harami pattern depending on their potential – Bullish Harami and Bearish Harami.
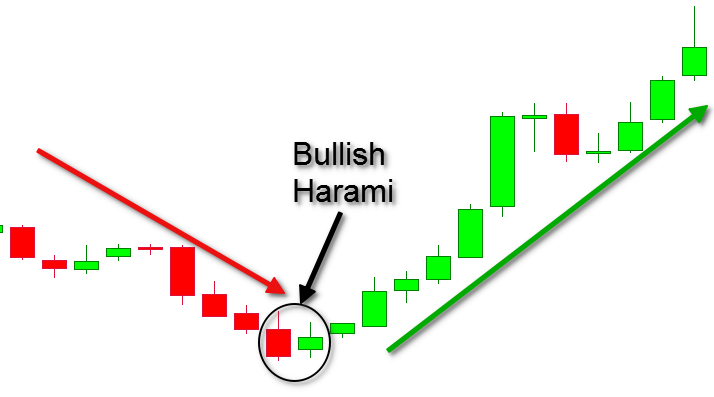
The Bullish Harami starts with a bearish candle, followed by a smaller bullish candle, which is engulfed by the bearish candle. After a Bullish Harami pattern we expect the price to increase.
The Bearish Harami is opposite to the Bullish Harami. It starts with a bullish candle, followed by a smaller bearish candle, which is engulfed by the bullish candle. After a Bearish Harami, we are likely to see a price drop as shown on the image below.
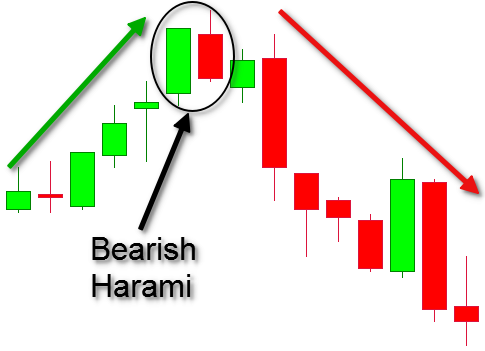
It is important to mention that Harami patterns are good for trend continuation confirmation too. When the price is increasing and a Bullish Harami appears on the chart, this means that the increase is likely to continue. Opposite to that, if the price is increasing and we see a Bearish Harami on the chart, we are likely to see a continuation of the bearish trend.