
Candlestick charts have become the chart type of choice for traders around the world. They offer a huge amount of versatility in technical analysis while requiring very little price data as inputs and make it easy to visualize key changes in stocks’ trading patterns. This article will introduce candlestick charts and explain many of the bullish and bearish candlestick patterns commonly used by investors.
What are Candlesticks?
Candlestick charts originated in Japan in the early 1800s, but after making the jump to traders in the US and Europe in the late 20th century they quickly came to dominate technical analysis charts. Candlesticks are so named because they feature a box and lines on either end that resemble wicks. The top and bottom of the box represent the opening and closing price of a stock. Which end is which depends on whether the stock’s price rose or fell over the period the candlestick represents – in the case of a price rise the top indicates the closing price, whereas in the case of a price fall the top indicates the opening price.
The advantage of this design is that it makes it easy to identify the difference between opening, closing, high, and low prices for a specified period. By coloring candlesticks green and red or white and black according to whether a stock’s price rose or fell over the candlestick’s period, it is also easy to visually identify trends in prices over time. While candlesticks are frequently used to represent a single day of trading, candlesticks can be used to span any time period and are frequently used on hourly, weekly, or monthly charts as well.

What is a Reversal Pattern?
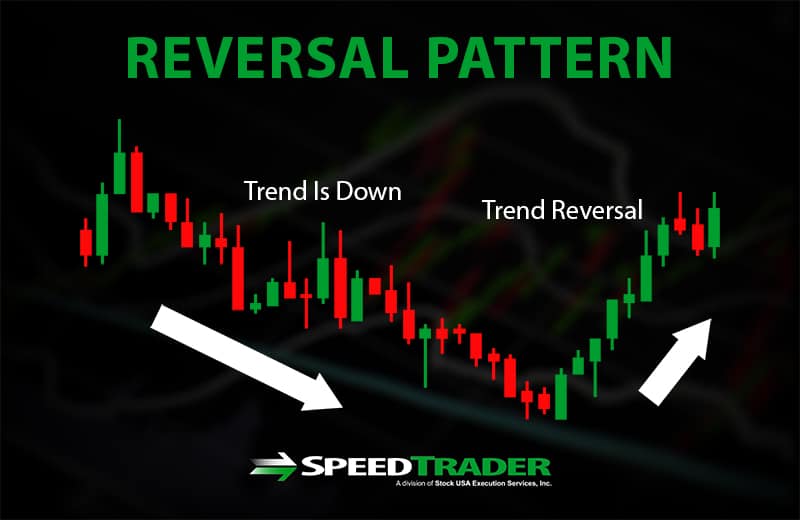
A reversal pattern is simply a change in the prevailing direction of a stock’s price trend. If a stock’s price has been steadily rising for some time – hours, days, or months depending on the chart period you are interested in – a reversal pattern would occur if the price began to fall for a correspondingly long period. The price highs and lows following the reversal would be lower than the highs and lows before it. A reversal pattern can also occur at the end of a downtrend if the stock price begins steadily rising and produces higher highs. Candlestick charts make it easy to identify and trade both bullish and bearish reversal patterns.
Note that, as with all technical analysis, indicators that a reversal pattern will occur or continue are not guarantees. Always be careful to place stop losses or limits when trading reversal patterns to protect your positions in the event that a reversal does not develop or continue as anticipated.
Bullish Reversal Patterns
Bullish Engulfing
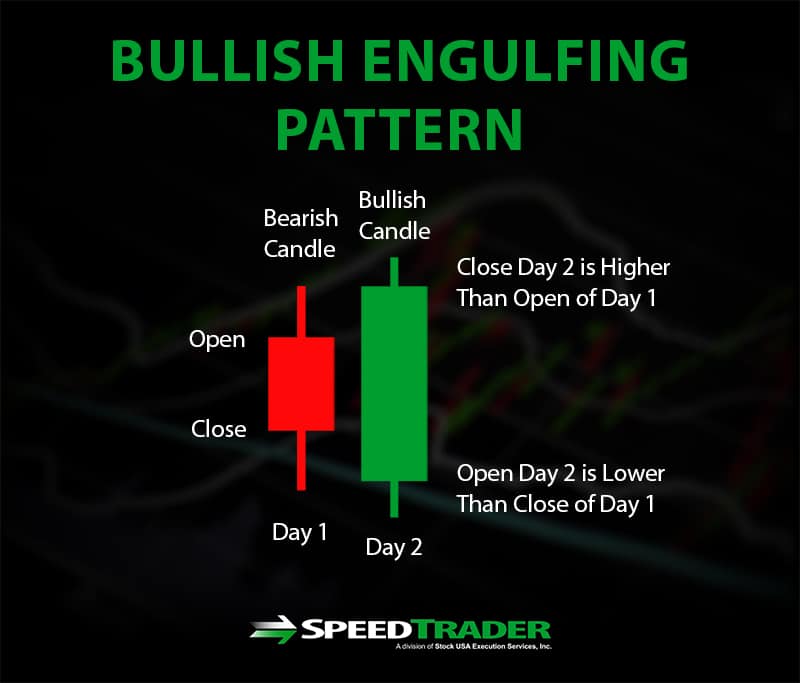
A bullish engulfing pattern signals a reversal from a downtrend in stock price to an uptrend, and occurs when the current day’s candlestick fully overshadows, or engulfs, the previous day’s candlestick. That means that the stock gapped down in pre-market trading, pushing the bottom of the current candlestick below the bottom of the previous candlestick. The stock price may decrease further during the day, but importantly closes higher than the previous day’s high so that the current candlestick’s top is higher than the previous candlestick’s upper wick. This pattern indicates that the selling off in pre-market or early in the day has been replaced by buying activity, pushing the price of the stock above the previous day’s high.
For this to truly signal a reversal pattern the closing price should be near the day’s highs, resulting in little upper wick on the candlestick. In addition, the closing price on the following day should push even higher to indicate that the reversal will follow through.
Piercing Pattern
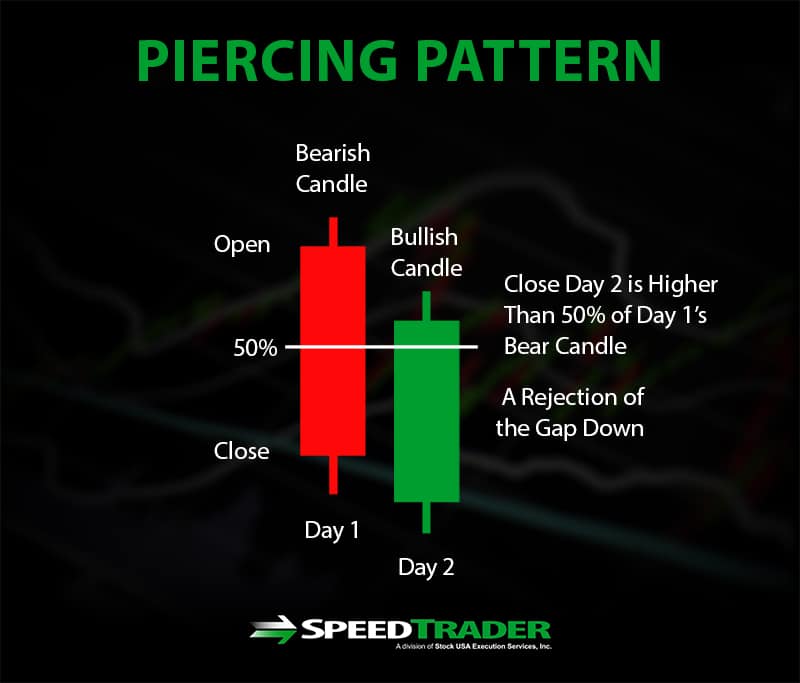
The piercing pattern is very similar to the Bullish Engulfing, but signals a less aggressive bullish reversal. The Piercing Pattern requires that the current day’s opening price gaps down below the previous day’s low, only to then rise throughout the day. The Piercing Pattern is signaled when the closing price is above the halfway point between the previous day’s opening and closing price – that is, half of the previous day’s losses are recovered by the current close. While this may not signal a continued reversal if the previous downtrend was strong and extended, it is a good sign that buying activity was able to overcome selling pressures and increase demand for the stock. However, consider looking for a further price rise on the following day or increased trading volume before buying.
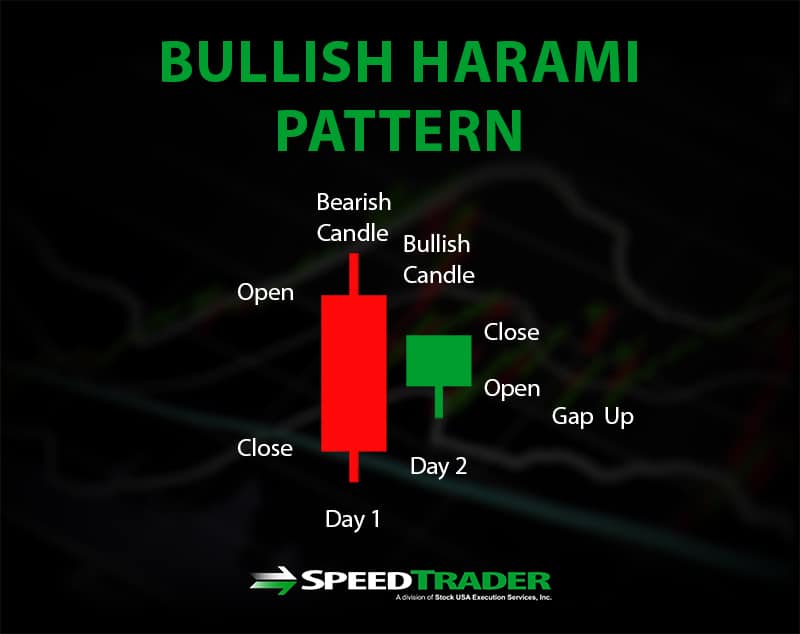
Bullish Harami
The Bullish Harami is observed when the price of a stock gaps up in pre-market trading and remains above the opening level by market close. Although the price does not need to close above the previous day’s opening price, positive price action after the gapped-up open is necessary to signal the Bullish Harami. If the closing price breaks above the trendline during the previous downtrend period, this pattern is likely to signal a continued reversal and it may be a good time to buy.
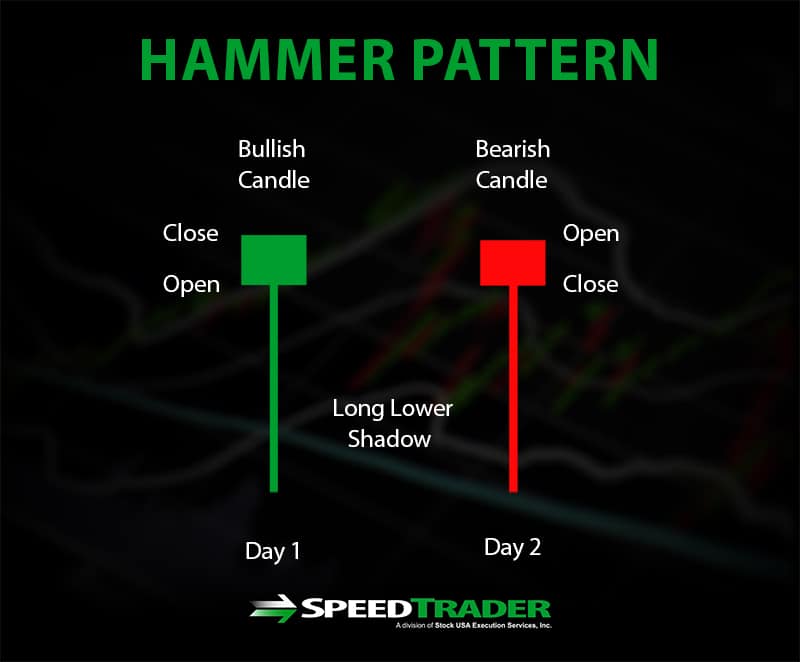
Hammer
The Hammer is signaled when a stock’s opening, close, and high price are all very similar while the low was significantly lower. The resulting candlestick resembles a hammer with a short candle between the open and close prices and a long lower wick that should be at least twice the length of the candle itself. The Hammer is strongly bullish when the stock closes at or near its high price for the day and weakly bullish when the stock closes at or near its opening price for the day. This pattern is thought to indicate that selling has reached its maximum and traders have begun to buy again as the stock price tests its lows. However, the reversal is not confirmed until the stock gaps up the following morning and the day’s lows remain above the hammer’s highs.
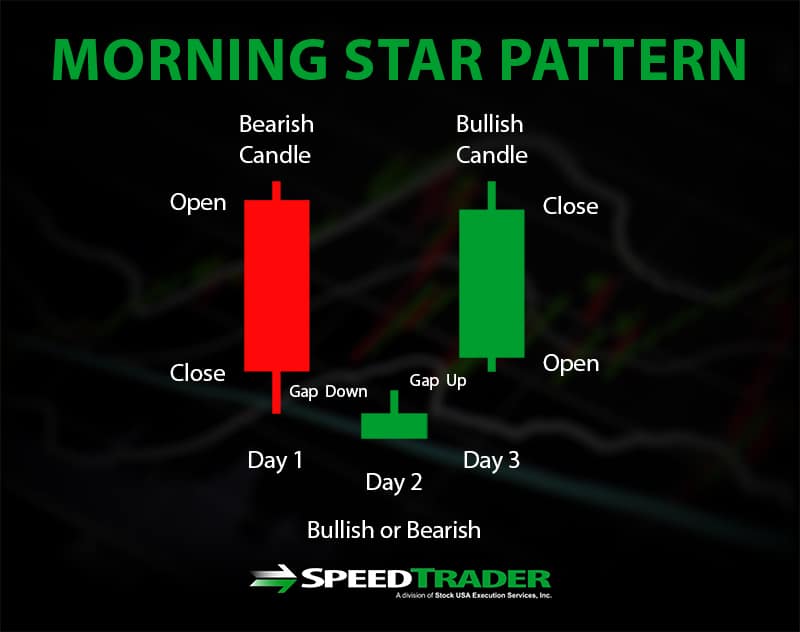
Morning Star
The Morning Star develops over two days of bullish activity that occur after a day of significant price drop and potentially new lows. On the first day of bullish activity, the stock price gaps down but does not significantly drop in price below the open. A slight increase in price by the day’s close indicates that the Morning Star may be more likely to develop, but a small loss on this day does not negate the pattern formation. On the following day, the stock should gap up and the price should continue to increase such that the losses from the two previous days are erased or nearly erased.
Bearish Reversal Patterns
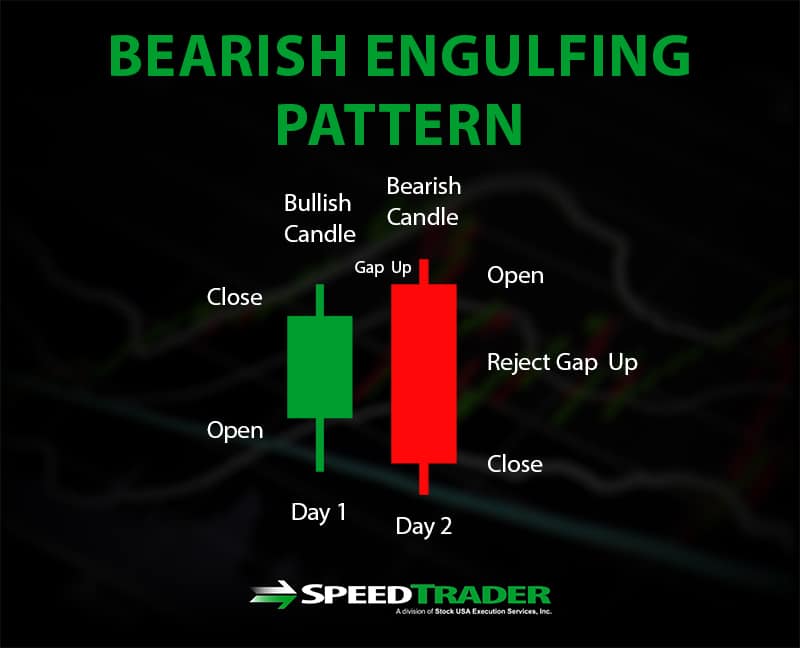
Bearish Engulfing
The Bearish Engulfing is essentially the reverse of the Bullish Engulfing and involves a negative candlestick that fully eclipses the previous day’s positive candlestick. The engulfing requires the price to gap up so that the open is above the previous day’s high, but to then drop throughout the day such that the new closing price is lower than the previous day’s low price. The lower the closing price falls below the previous day’s opening price, the more likely it is that the Bearish Engulfing signals a continuing reversal from the previous uptrend.
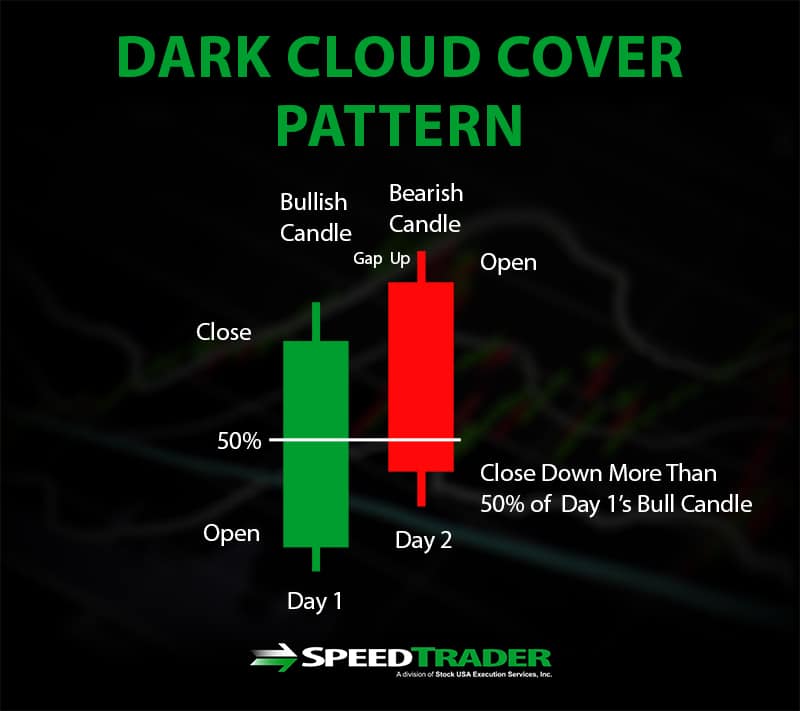
Dark Cloud Cover
The Dark Cloud Cover pattern is the inverse of the bullish Piercing Pattern and occurs when a bearish candlestick closes below the halfway point of the previous day’s bullish candlestick. This means that following a day of price increase the price gaps up into the next day before dropping and closing at or beyond midway between the previous day’s opening and closing prices. While this is not as strong a bearish signal as the Bearish Engulfing, it may indicate it is time to sell before the downtrend continues and erases gains from the previous uptrend.
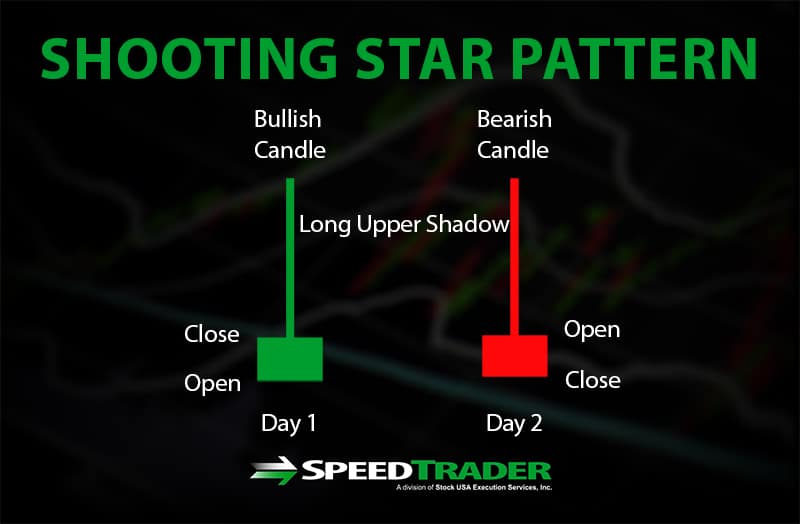
Shooting Star
The Shooting Star is the bearish counterpart to the bullish Hammer pattern. It occurs when the open, close, and low are similar in price, while the high is greater than twice the difference between the open and close. The resulting candlestick has a stubby body with a long upper wick, resembling a shooting star. The price may either increase or decrease from open to close, although a decrease is a stronger bearish signal. This pattern indicates that selling has overpowered buying and suggests a reversal from uptrend to downtrend.
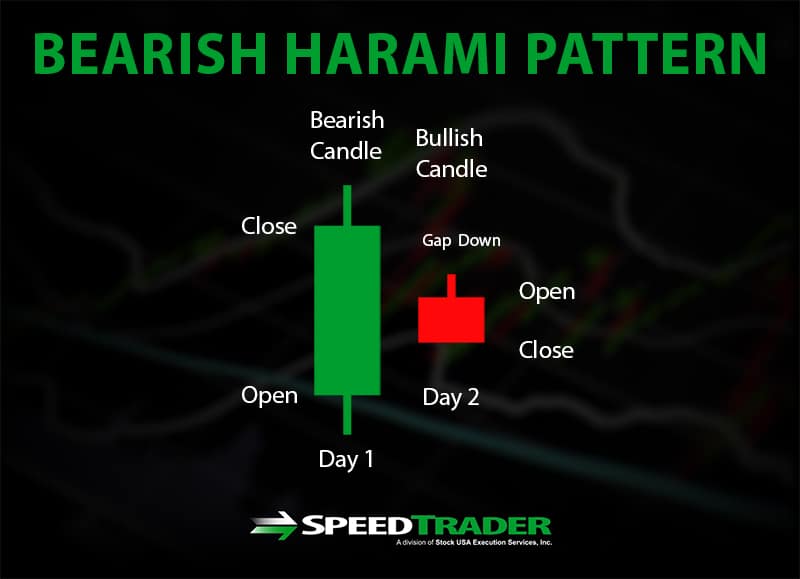
Bearish Harami
The Bearish Harami occurs when a stock’s price gaps down following a day of bullish activity and then closes below the opening price for a loss on the day. The entirety of the bearish candle should be engulfed by the preceding bullish candle. The reversal will typically continue after a Bearish Harami if a loss also occurs on the following day so that the stock’s price falls well below the previous upward trendline.
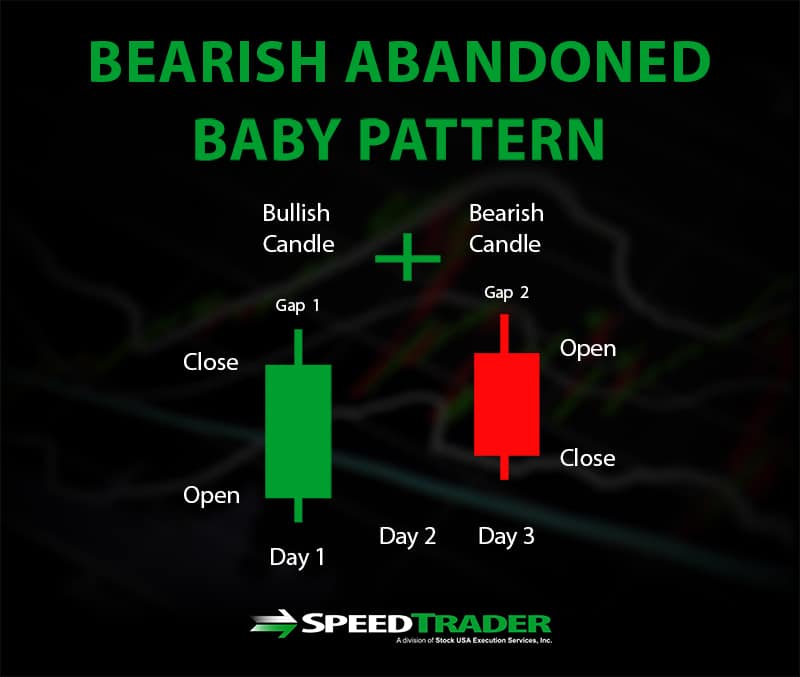
Bearish Abandoned Baby
The Bearish Abandoned Baby is a less common reversal signal that occurs over two days. A Doji candlestick, in which the opening and closing prices are equal, gaps up above the closing price after a large bullish candlestick. The Doji candle should gap up enough that it does not overlap at all with the previous bullish candlestick’s body or upper wick. On the next day, the opening price should gap down below the Doji candlestick’s lower wick and the price should drop sharply by market close. The Bearish Abandoned Baby pattern leaves little time to exit at the uptrend’s high but is relatively reliable at signaling a reversal even in the absence of other indicators.
Conclusion
Using technical analysis to identify when an extended uptrend or downtrend in prices is coming to an end is important for traders aiming to sell high and buy low. Candlestick patterns offer an easy way to visually identify reversal patterns when used in conjunction with other technical indicators. There are many candlestick patterns that signal both bullish and bearish reversals and quickly recognizing these patterns can make a large difference in anticipating changes in stock prices.