What are Fibonacci Retracements? A Fibonacci (fib) retracement is a support and/or resistance price level that is calculated by applying key Fibonacci ratios to a pre-selected price high and low range. Stock prices tend to pullback or retrace to one or more of these...
What is a Stock Scanner? Stock scanners are automated tools that filter through the markets to find stocks that match a pre-selected set of technical and or fundamental criteria. Technical scans can consist of specific candlestick formations, price alerts (new highs...
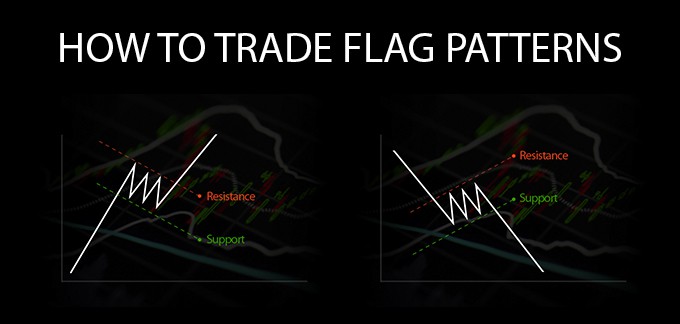
What is a Flag Pattern? A flag pattern is a trend continuation pattern, appropriately named after it’s visual similarity to a flag on a flagpole. A “flag” is composed of an explosive strong price move that forms the flagpole, followed by an orderly and diagonally...
Why Multiple Time Frames? It can be very confusing when an investor sees a stock that is up trending, while a day trader clearly sees a downtrend at the same time. A stock (or any financial instrument) can absolutely be up trending and downtrending simultaneously....
What is Trend Reversal? A trend reversal occurs when the direction of a stock (or any financial trading instrument) changes and moves back in the opposite direction. Up trends that reverse into downtrends and downtrends that reverse into up trends are examples...
What is Support and Resistance? Support and resistance are price levels that the underlying stock (or any financial trading instrument) can’t break through or exceed after multiple attempts. A support level is a price level that a stock can’t seem to fall under due...