Technical traders rely heavily on the use of charts in order to make trading decisions. While there are many ways to analyze price action, utilizing chart patterns is one of the most popular ways. Chart patterns can be used to analyze the psychology of the market, allowing traders to predict a stock’s future price action.
Triangle patterns are some of the most commonly used chart patterns within the world of trading. The vertex of a triangle pattern represents a pivotal point during an ongoing battle between the bulls and the bears, thus making it an attractive setup for traders. The three most common triangle patterns include symmetric, descending, and ascending. Today, we will discuss the ascending triangle pattern.
Elements of an Ascending Triangle Pattern
An ascending triangle pattern is comprised of two key elements:
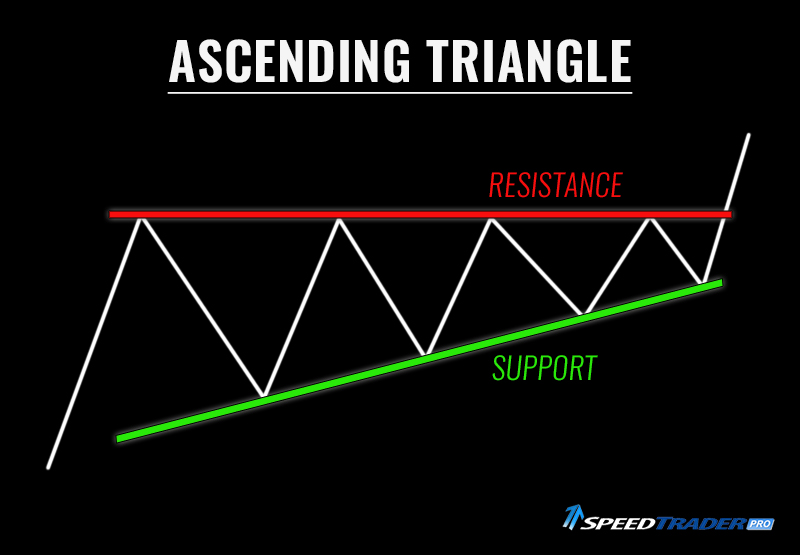
1. Bottom Trend Line (Support) – An ascending triangle is characterized by a bottom trend line that is formed as the stock continues to set higher lows. The more touch points on the trend line, the more reliable it will be.
2. Flat Resistance Line – An ascending triangle also contains a flat horizontal resistance line that is formed as the stock continues to reject its previous highs (for a given period). Once again, the more touch points on the resistance line, the more reliable the pattern will be.
Characteristics of an Ascending Triangle Pattern
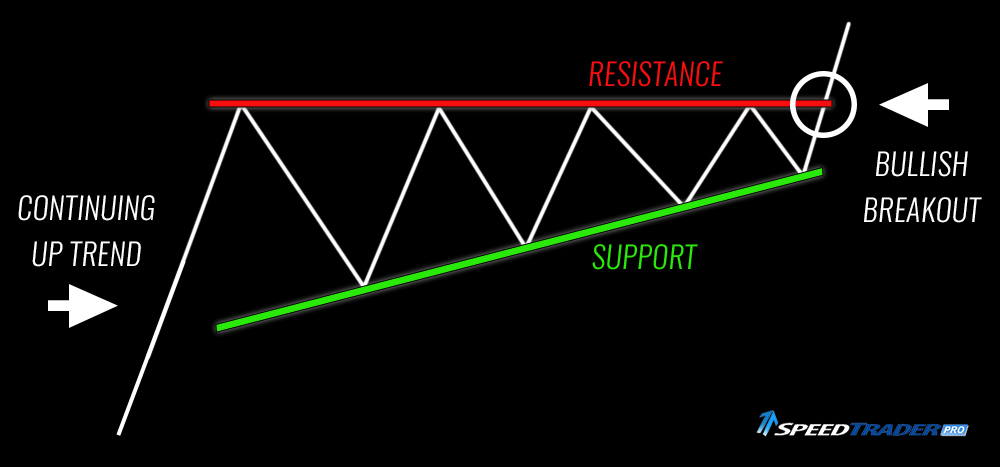
Bullish Pattern – An ascending triangle is considered to be bullish, meaning traders will be looking to initiate a long position upon a break of the upper resistance level.
Continuation Pattern – An ascending triangle is generally a continuation pattern, meaning that it’s predictive nature is most effective when a stock is continuing an uptrend.
Timeframe – Ascending triangles can be used on multiple timeframes. They may exist on intraday charts, hourly charts, daily charts, and weekly charts.
Psychology Behind the Ascending Triangle Pattern
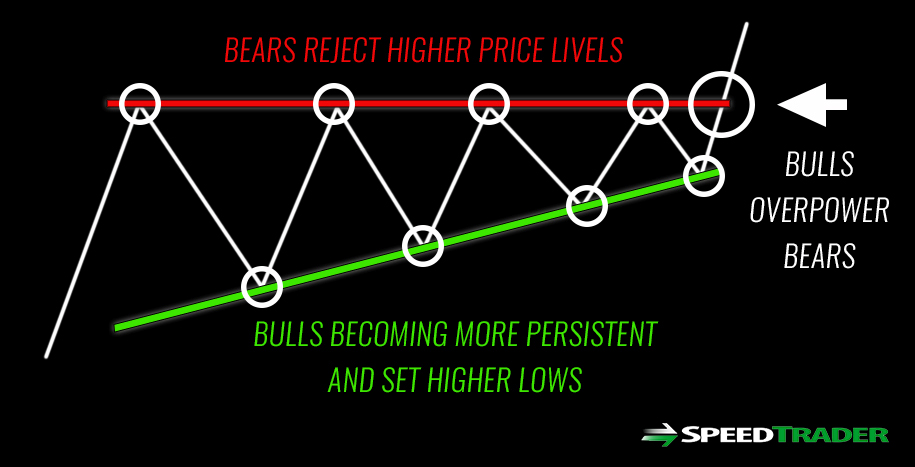
It can be helpful to think of the ascending triangle pattern as a visualization of an ongoing battle between the bulls and the bears. The bulls keep pushing the stock up in price until they get overpowered by the bears (at the flat resistance level). The bears attempt to push the stock down, however the bulls are persistent and the stock sets a higher low (bottom trend line).
This pattern continues until the price action becomes confined to the vertex of the triangle, representing a pivotal moment in this battle. At this point, either the bears will win and the stock will break the bottom trend line, or the bulls will win and break the flat resistance line. Historically speaking, this pattern favors the bulls, and if the flat resistance line is broken, the bulls will be able to push the price up, triggering a breakout.
How to Trade the Ascending Triangle
It’s important to keep in mind that even though this is a bullish pattern, a breakout is not guaranteed. Chart patterns should be used as tools, not definitive solutions for conquering the market. Therefore, you should still apply your other trading rules and strategies when utilizing chart patterns.
Here are a few guides for placing a trade based on the ascending triangle pattern.
Wait for the Breakout – Unless you’re experienced in trading ascending triangle patterns, you should wait the stock to break above the flat resistance line before placing a trade. You may get a better price if you buy shares earlier, but you are also exposing yourself to additional risk. Be patient and set an alert in your trading software if you’d like.
Look for Volume – High volume in the stock market represents conviction behind a move, indicating that a large amount of traders want a position in the stock. While above average volume is not necessary for an ascending triangle pattern breakout, it may increase the likelihood of a stronger move.
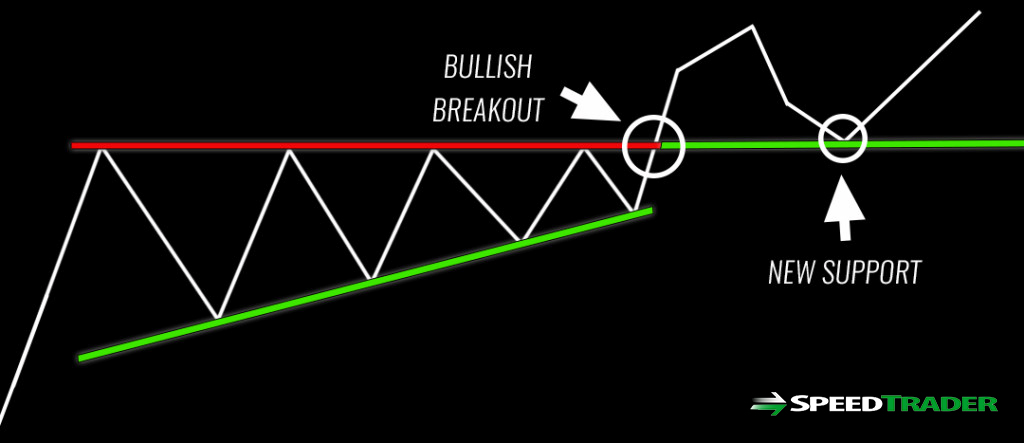
Look for Confirmation – If an ascending triangle breakout is genuine, the flat line resistance level should become a support level. If the stock starts to pullback after the breakout, you should look for the previous resistance level to hold as support. This will help confirm the legitimacy of the breakout. It also allows traders who missed the initial move to take a position.
Have an Exit Plan – All trades require an exit plan for both favorable and unfavorable outcomes. If the stock pulls back and breaks the support level (previous flat line resistance), you may consider exiting your position, as the legitimacy of the breakout is in question. You will also want to have a plan for when to take profit if the stock moves in your favor.