

As the name suggests, a golden cross is a good signal for a stock – the golden cross indicates a bullish breakaway may be about to happen. The golden cross is based on changes in the short- and long-term moving averages of a stock and is frequently used by swing investors as a way to gauge when the time is ripe to open a position. This article will introduce moving averages and golden crosses in detail, plus offer tips on the best ways to trade this pattern for profit.
Moving Averages
Moving averages are key metrics for traders to watch. These indicators play a role in identifying numerous trading patterns – including the golden cross. The goal of a moving average is to smooth out changes in the price of a stock over a specified period. The time period may be short – 10 days is commonly used, although hourly moving averages are possible – or long – 50, 100, and 200 days are all common.
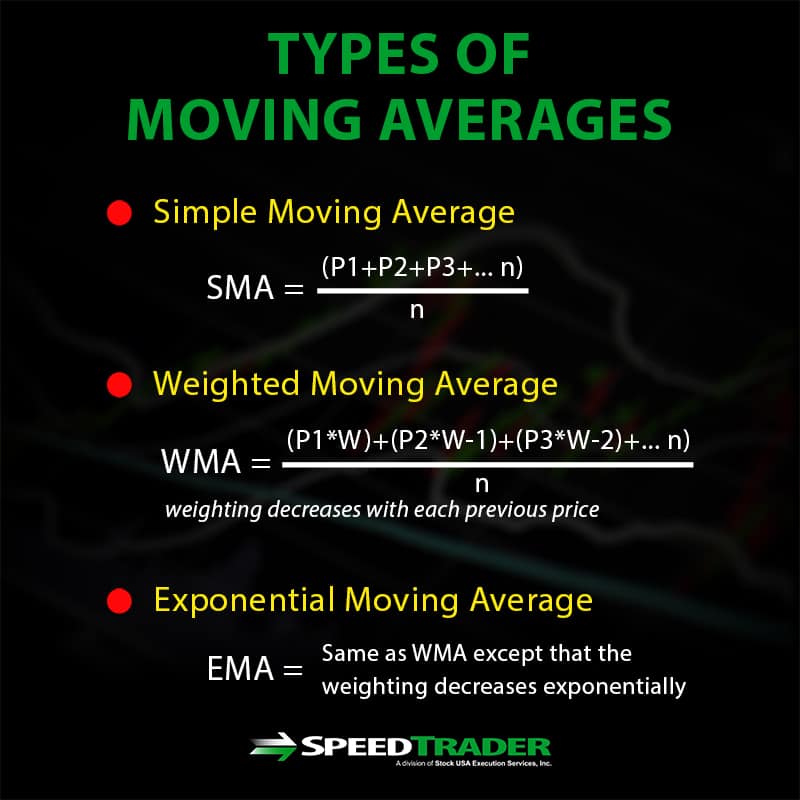
Moving averages can be calculated in several different ways for a given time period. The most basic calculation is the simple moving average, which simply averages the closing price of a stock from the current day all the way back to the specified number of days. The average is “moving” because with each future day, the oldest number in the previous day’s average is dropped from the calculation and the new day’s price is added. Exponential moving averages are similar to simple moving averages, but the average is weighted so that more recent prices affect the calculated average more than older price data. Although exponential moving averages are more complex to calculate, they are more frequently used among traders because they better represent recent changes in price trends.
Traders tend to focus on the 50-day and 200-day moving averages, either simple or exponential. These moving averages are favored because the shorter moving average removes day-to-day volatility when analyzing recent price changes, while the longer moving average gives an indication of how a stock’s price has performed over a significant timescale while removing small weekly dips and rises.

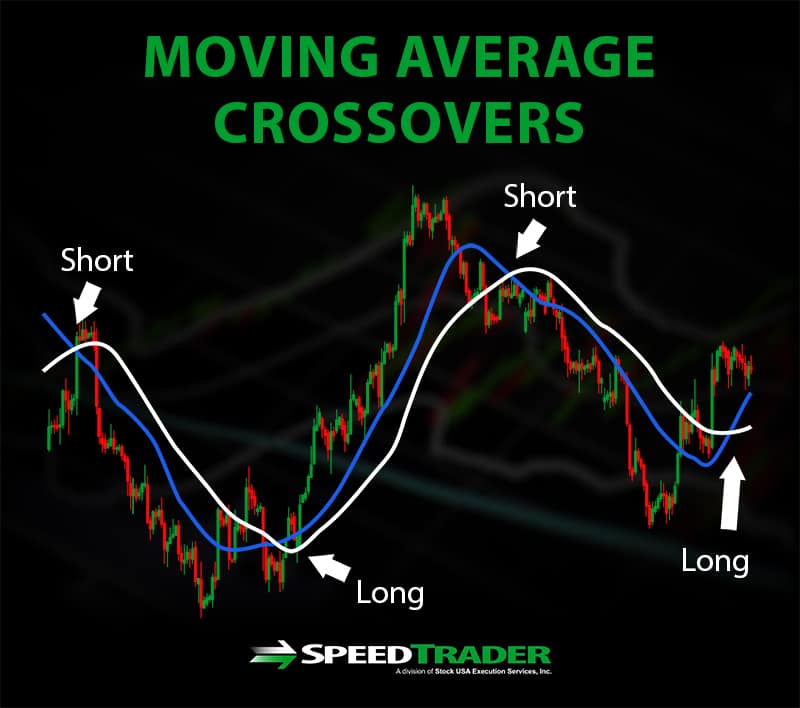
Moving Average Crossovers
Moving average crossovers – when a short-term moving average crosses above or below a long-term moving average – are significant signals for traders. The reason is that by such a crossover by definition indicates that the price is trending up or down relative to what it has been for some time. The crossover event itself suggests that the new trend has momentum. Many traders like to trade based on moving average crossovers in part because there is no question in identifying them once the time periods for the short- and long-term moving averages are set.
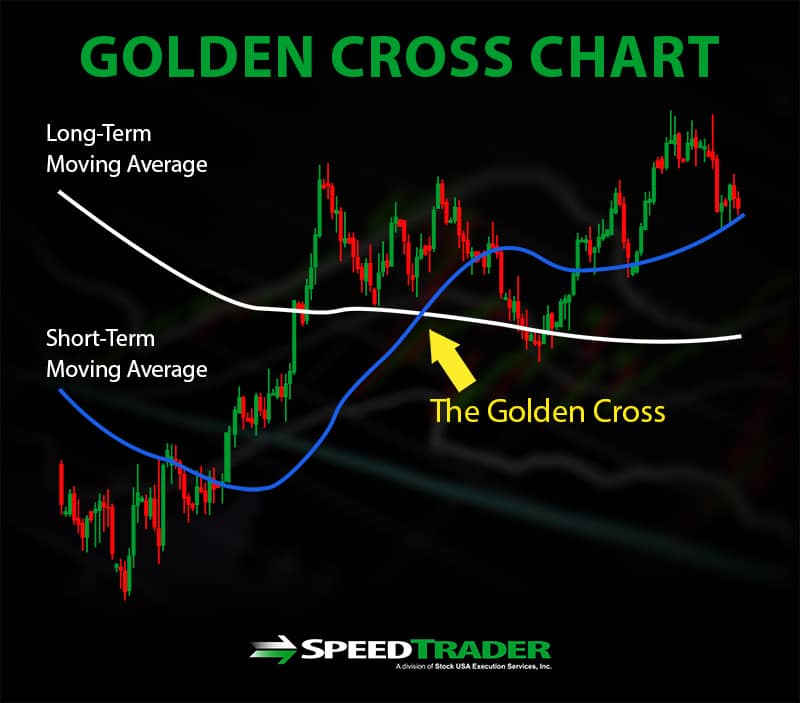
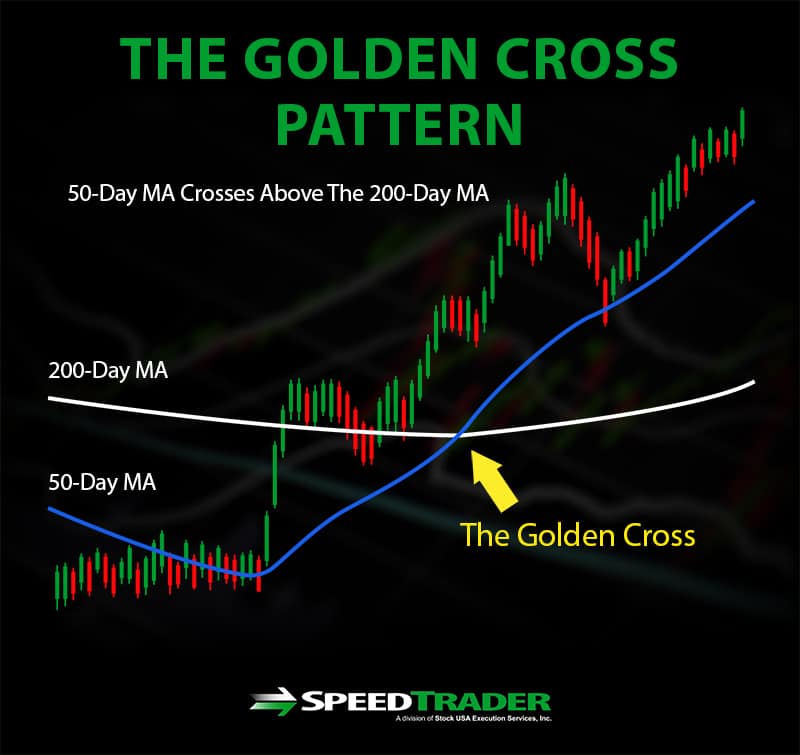
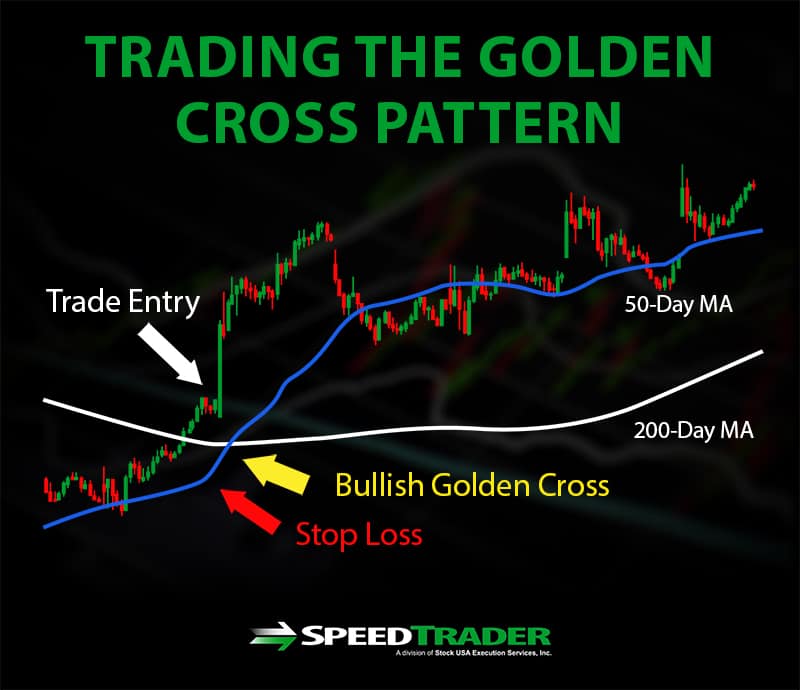
The Golden Cross
The golden cross refers to a pattern in which the 50-day moving average crosses above the 200-day moving average, indicating a bullish trend and potential upward breakaway. This crossover requires that a recent bearish trend reverses into a bullish pattern as selling tapers off. After the crossover occurs, the golden cross is completed if the 50-day moving average continues to rise above the 200-day moving average rather than cross back below it. Typically, the golden cross is associated with a spike in trading volume.
Trading the Golden Cross
Trading the golden cross is all about timing. Since the trend following the cross is expected to be fully bullish, it is best to take a position as soon as possible after the golden cross is identified. Stop losses are important for protecting an investment in case the crossover reverses in this case. Placing a stop loss just below the crossover price allows the stock price some wiggle room around the crossover but will also ensure that losses are minimized in case of a reversal. When in doubt, use other indicators such as the moving average convergence divergence (MACD) to assess whether the golden cross seems likely to continue.
Although there is no simple metric for predicting the price high following the development of the bullish continuation, the magnitude of the trend can be gauged. Typically, the longer the crossover took to develop – that is, the longer the preceding sell-off took – the longer the bullish trend is expected to last. Additional indicators, in particular the relative strength index (RSI), can help to evaluate when the stock may be overbought.
The exit point following the golden cross is easy to identify. The death cross is the opposite of the golden cross, in that it is signaled when the 50-day moving average drops below the 200-day moving average and indicates that the price is likely to decline sharply. Placing trailing stop losses at the value of the 200-day moving average as it increases during the bullish pattern is an easy way to ensure that profits from trading the golden cross are locked in and avoid losses following a death cross.
Conclusion
The golden cross is a signal that is widely used among traders for identifying the start of a bullish trend in a stock. This signal is favored in part because it can be objectively identified from technical analysis as the point at which the 50-day moving average crosses above the 200-day moving average. The golden cross can be traded with relatively low risk by placing stop losses around the level of the 200-day moving average throughout the bullish pattern.