

What is a Stock Scanner?
Stock scanners are automated tools that filter through the markets to find stocks that match a pre-selected set of technical and or fundamental criteria. Technical scans can consist of specific candlestick formations, price alerts (new highs and lows), % price changes to specific chart patterns all based solely on the stock price action. Fundamental scans consist of financial metrics pertaining to the actual business operations like price earnings (P/E) ratios, market capitalization, revenue and income growth, book value, cash per share and so on.
Scanners can be very effective utilizing the speed of technology to provide potential candidates to trade. However, they can also be detrimental if traders are not selective and spread themselves too thin. While scanning programs have advanced tremendously, you have to keep in mind, they only provide candidates that you still have to analyze and monitor. They can help to find great trades but can also entice less experienced traders into overtrading stocks they have no business playing.
What is the Goal of Creating a Scan?
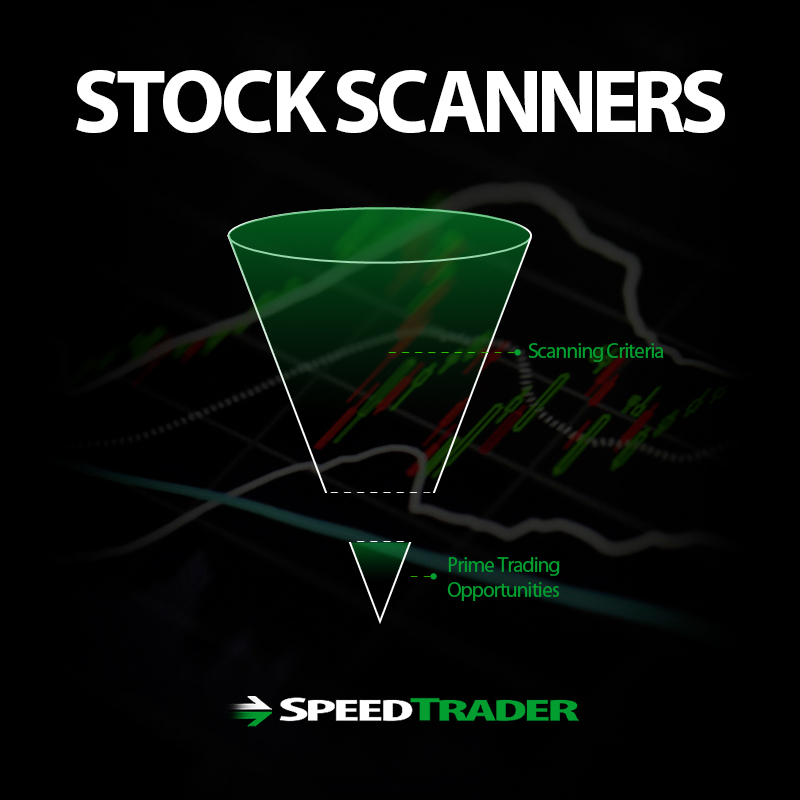
The goal for creating a scan is to find those few gems that are ripe for high probability trade set-ups. By selecting criteria carefully, it can help to filter through the noise detect stocks that are viable for trading. To ensure this, you must have some basic criteria as well as specific criteria. Many scanners have pre-programmed scans that may need to be tweaked to be most effective.
Criterion For a Good Stock Scan
Every trader has a trading style, strategy, types of stocks and plays. A solid stock scan is an extension of your trading strategy. Tailor the scans to fit your niche in regards to rhythms, industries, patterns and style. The most basic criteria a trader should specify are the minimum trading volume and minimum/maximum price and exchanges. As a basic rule, less experienced traders should stick with at least 5 million shares minimum trading volume to ensure better liquidity. The heavier the average daily trading volume, the more liquidity there should be. This helps to avoid slippage. The minimum and maximum price range (for the stock candidates) will largely be determined by the amount of capital you are trading with. Initially a range of $15 minimum to $60 maximum is an ideal starting point. As for specific criteria, this depends on how fluent the trader is with specific patterns they want to search for.
What to Avoid
When specifying your stock scans, its important to filter out stocks that you normally wouldn’t trade in the first place. You can do this by specifying exchanges, average trading volume, price range and triggers, volume triggers, types of stocks and so forth.
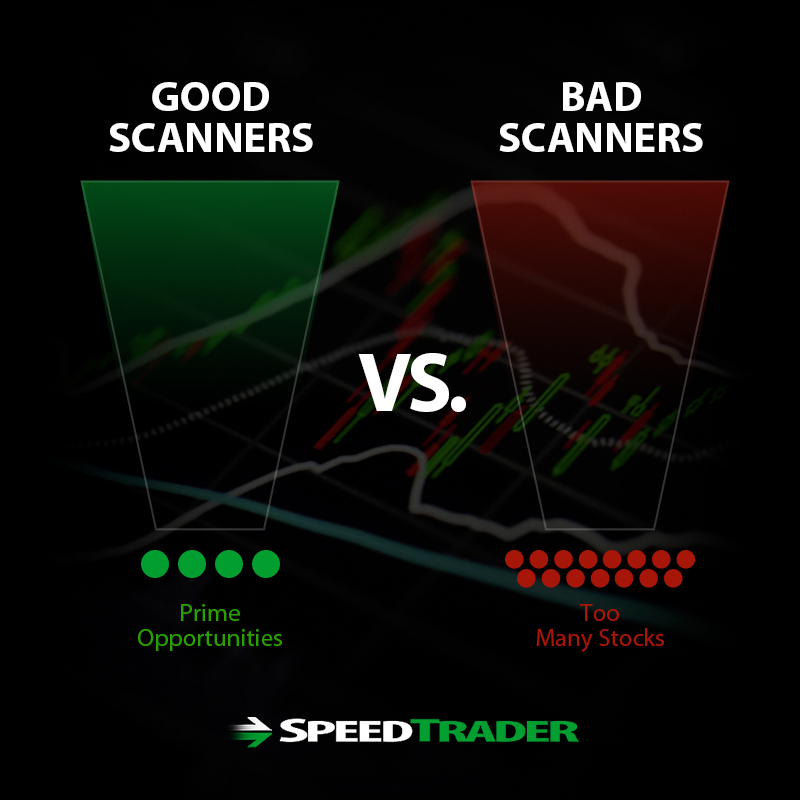
The more selective your parameters, the more effective your scanner will be.
Ideally, you want to have your scanner spitting out a handful of results. If the results number in the hundreds, then you know the parameters are too broad and need to be tightened up.
Pitfalls of Using Stock Scanners
A scanner can make a good trader more effective, but it can make a poor trader even poorer. Just like a swordsman becomes more powerful with a sharper blade, an inexperienced amateur is more likely to be exposed to higher risk.
One of the inherent problems with scanners is that they find candidates at the point of peak transparency. Algorithm programs are fully aware that stocks making new highs or lows will hit the scanners and invite in a new batch of amateurs chasing the trades. Rinse and repeat.
If You Don’t Know Who the Mark Is, Then It’s You
It’s like the anecdotal 10-seat poker table where 8 of the seats are held by the ‘regulars’ that prey on the tourists sit in the 2 open seats, as articulately illustrated in the movie “Rounders.” The pros will naturally try to take each other’s money. However, when a new batch of tourists occupies the open seats, they jump over each other to snatch the easy kill. As John Torturro says to his protégé Matt Damon, “If you can’t spot the mark (victim), then it’s probably you…”. Here’s how the same applies in the markets from the perspective of the ‘tourist’.
The Typical Mark
Does this routine sound familiar to you? Mark sees a stock pop up on his stock scanner meeting a pre-set pattern. Immediately (and impulsively) he buys the stock, as it looks identical to the pattern he saw in a book. He also notices how quickly the level 2 screen is climbing with bidders. Mark ends up chasing the price as it spikes fast. Once he finally gets his position, the stock pops a few pennies and then suddenly all those stack of bids evaporate as the price collapses on him. Desperately, he stops out with a market order near the low of the panic. At this point, Mark decides to fade the initial pattern and he places a short-sell order on the stock when it starts to fall. Again, he can’t seem to get filled so he continues to chase the price lower until he is finally filled on his short position. The stock continues to fall for another minute or so and then stalls. He gets a queasy feeling in his gut, feeling a calm before the storm moment. Suddenly the stock rallies sharply against his position as he stares bewildered at his profit/loss blotter. He freezes like a deer in the headlights. Eventually, the losses mount so high that and he again stops out with a market order in a panic. He feels slightly better when the stock continues to rally higher, thinking he just saved himself from deeper losses. Mark figures he’s ‘done’ with this stock. Mark looks for another stock to jump in on thanks to his scanner.
Incidentally, the stock settles down back to its normal rhythm and resumes the breakout pattern (without Mark) as it proceeds to make new highs (without Mark). Later, Mark kicks himself as the stock pops up on his scanner again as it makes new highs. Mark jumps back in, rinse and repeat. After Mark throws in the towel, another batch of Marks occupy the open seats at the table. Rinse and repeat. The moral of the story is, don’t be a Mark. The lesson here is to monitor and observe new stocks rather then plunge into a trade head on.
How to Effectively Use Stock Scanners
First rule with using a stock scanner is to never impulse trade. All stocks have a sore rhythm and behavior that can also alter based on the context of the day. Some stocks only breakout after a headfake price dip. Some stocks are pretty transparent in their breakouts. This can only be ascertained from observing the stock first and foremost. This takes time and patience. Also keep in mind that scanners will find patterns after they have formed. This means the proverbial table is already seated. Therefore, you have to assume that any immediate trades you make are from the open seats, the Mark seats. Use the stock scan results to find initial candidates that you observe first and then adopt after thorough observation. Trade them only after monitoring both upside and downside moves and how they correlate with their peers and the general market. Watch to see how the initial pattern holds up or headfakes. Apply your indicators first and wait for the trade to come to you. Preparation is the key here.
A Scanner is a Tool and Nothing More
As you begin using stock scanners, it’s important to remember that a scanner is just a tool, and like any tool, it’s effectiveness relies heavily on its user. Do not expect scanners to magically provide great stocks to trade. Use a scanner to help automate your strategy and allow you to find trading opportunities more efficiently.
A scanner will help you filter out some of the noise of the markets. There are thousands of stocks you can trade every day and a scanner will help you narrow down your options. That said, it’s up to you to analyze each stock that shows up on your scanner in order to make sure it is a prime trading opportunity.