
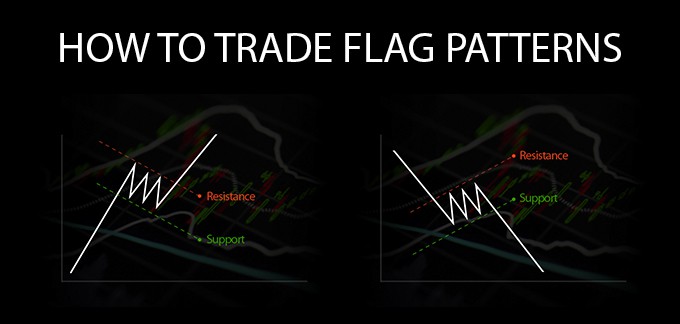
What is a Flag Pattern?
A flag pattern is a trend continuation pattern, appropriately named after it’s visual similarity to a flag on a flagpole. A “flag” is composed of an explosive strong price move that forms the flagpole, followed by an orderly and diagonally symmetrical pullback, which forms the flag. When the trendline resistance on the flag breaks, it triggers the next leg of the trend move and the stock proceeds ahead. What separates the flag from a typical breakout or breakdown is the pole formation representing almost a vertical and parabolic initial price move. Flag patterns can be bullish or bearish.
Bullish Flag
This pattern starts with a strong almost vertical price spike that takes the short-sellers completely off-guard as they cover in frenzy as more buyers come in off the fence. Eventually, the price peaks and forms an orderly pullback where the highs and lows are literally parallel to each other, forming a tilted rectangle.
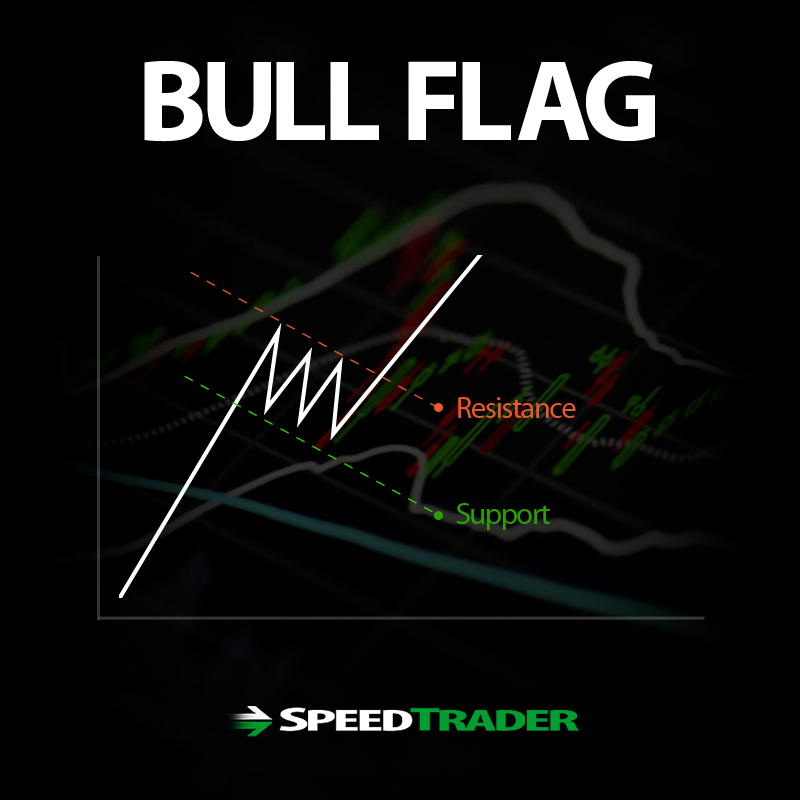
Upper and lower trendlines are plotted to reflect the parallel diagonal nature. The breakout forms when the upper resistance trend line breaks again as prices surge back towards the high of the formation and explodes through to trigger another breakout and uptrend move. The sharper the spike on the flagpole, the more powerful the bull flag can be.
Bearish Flag
The bear flag is an upside down version of the bull flat. It has the same structure as the bull flag but inverted. The flagpole forms on an almost vertical panic price drop as bulls get blindsided from the sellers, then a bounce that has parallel upper and lower trendlines, which form the flag.
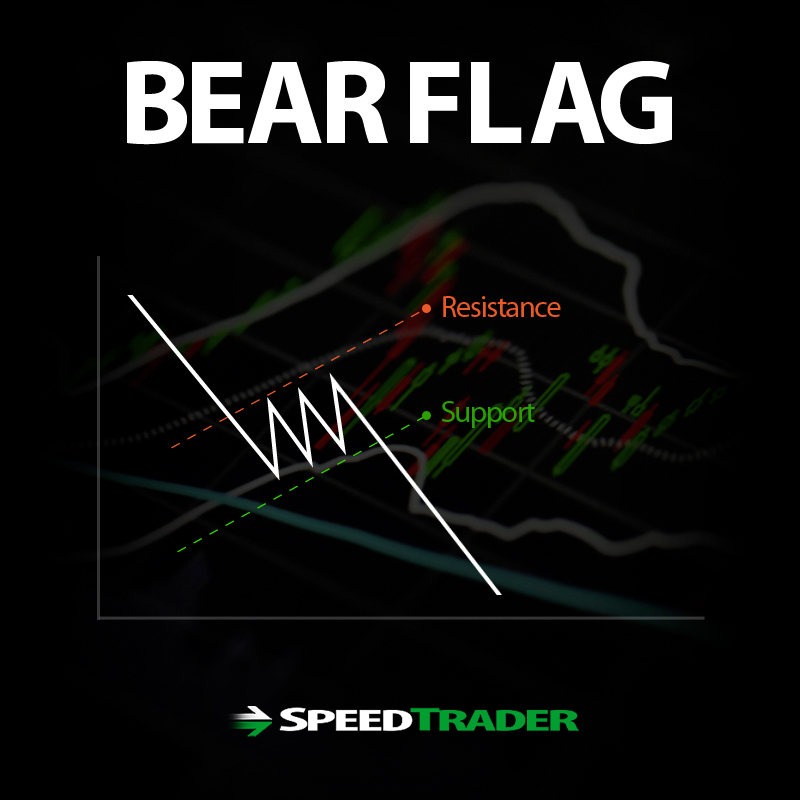
When the lower trendline breaks, it triggers panic sellers as the downtrend resumes another leg down. Just like the bull flag, the severity of the drop on the flagpole determines how strong the bear flag can be.
The Psychology of a Flag Pattern
Flag patterns start off violently as the ‘other’ side gets caught off guard on the trend move or as bulls/bears become overambitious. On bull flags, the bears get blindsided due to complacency as the bulls charge ahead with a strong breakout causing bears to panic or add to their shorts. Once the stock peaks out, the bears regain some confidence as they add to their short positions only to get trapped again when the breakout forms causing more short covering. Since short-sellers from the initial flagpole run up may still be trapped, the second breakout forming through the flag can be even more extreme in terms of the angle and severity of price move. This is when forced liquidations and margin calls kick in. The same happens on bear flags, just inversely.
How to Plan a Trade Using Flag Patterns
Flat patterns require the patience to wait for the flag to form and plot the upper and lower trendlines. These will contain your entry and stop levels. It is best to also use a momentum indicator like stochastic to time your entries. Use the 80/20 band stochastic crossovers to help time entries and exits.
Two Trade Entry Spots
There are two spots of entry on any flag formation when playing for the trend continuation break. The first entry is on the flag break and the second potential entry is on the break of the high of the flagpole. The first entry is an early entry that allows the trader to capitalize on an initial move back to the high of the flagpole before the stock rejects or breaks out. (graphics with entries and exit levels)
Two Trade Stop Loss Spots
A flag pattern also allows for two measured stop-loss levels if the stock fails to hold its momentum. The initial stop-loss can be placed under the upper trendline on uptrends and lower trendline on downtrends, as a precautionary trail stop. However, some traders may wish to give it more room to avoid wiggles and place their stop at or under the lower trendline on uptrends and lower trendline on downtrends. Using the second trendline stop-loss may be more costly but it avoids wiggles at the first trendline from triggering premature stops. To offset some of the risk, lighter shares can be used when trailing the second trendline stop-loss.
Target Price Levels
Once you entry a flag pattern, the targets can be derived from many indicators. The initial targets on all flag patterns will be the high or low of the flagpole. If the flagpole price peak is exceeded, then you can use Bollinger Bands and or fib price levels. To get fib price level targets, first plot the high to low and low back to high price levels of the flagpole. This should not only give the fib retracement levels but also the fib extension levels. There are three potential price target levels indicated by 1.27, 1.414 and 1.618 fib extensions, which each double as a potential price reversal zone (PRZ).