

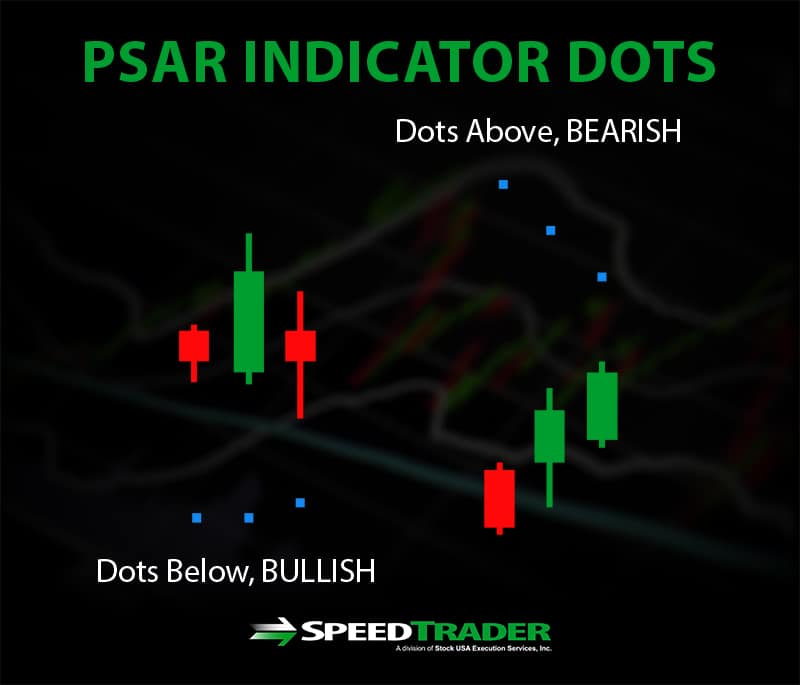
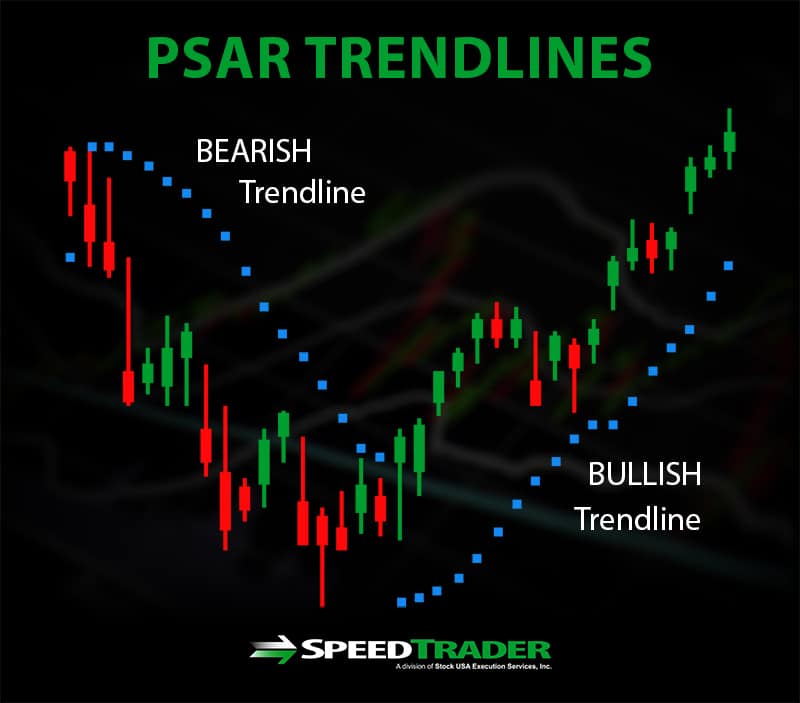
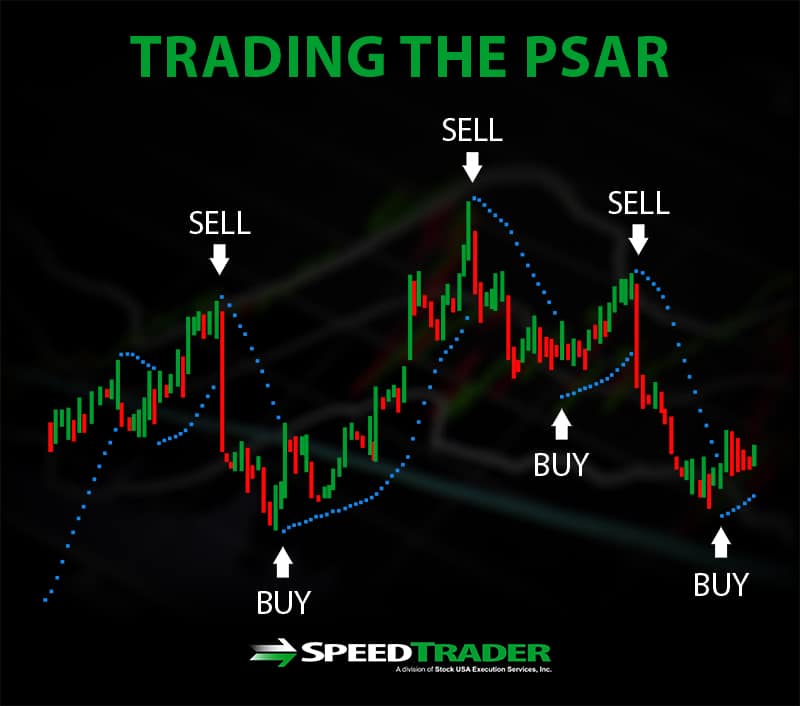
The parabolic stop-and-reverse (PSAR) indicator was first introduced by technical analyst Willes Wilder in his 1978 book New Concepts in Technical Trading Systems and has been widely used by traders ever since. The PSAR is used on trending stocks to indicate whether the current price trend is likely to continue or to reverse. The indicator is shown as a series of dots above or below the price data on a stock’s price chart – above if the price is trending downward, and below if the price is trending upward. When the dots move from above the price data to below it, that is typically considered a buy signal, while the opposite movement from below to above price data is considered a sell signal. The prices of the dots themselves are also considered a good level to place stop-loss orders to reduce risk.
PSAR Calculation
The PSAR indicator is somewhat complex to calculate by hand and most traders simply use trading software to chart it.
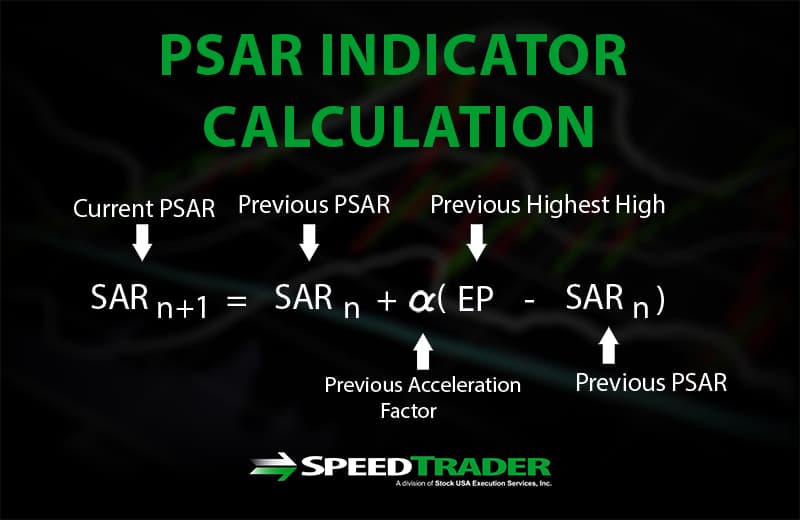
The PSAR for an uptrend requires knowing the PSAR value, acceleration factor (discussed below), and highest high of the previous uptrend. With these values in hand, the current PSAR for an uptrend can be calculated as:
For a downtrend, calculation requires the previous period’s PSAR, the lowest low of the previous downtrend, and the previous acceleration factor. The current PSAR for a downtrend can be calculated as:
Current PSAR = Previous PSAR – Previous acceleration factor * (Previous PSAR – Previous lowest low)
Elements of the PSAR Indicator
Acceleration Factor
One of the variables you will need to set when calculating and charting the PSAR indicator is the acceleration factor, also known as the step. The acceleration factor determines the rate of change of the PSAR as an uptrend establishes new highest highs or a downtrend establishes new lowest lows. With each new extreme point in the trend, the acceleration factor increases by a set increment – thus pushing the PSAR ever closer to the stock price, and thus indication of a reversal. The acceleration value is typically set to start at 0.02 and increase in steps of 0.02 up to a maximum of 0.20 for commodity or currency trading. For stock trading, to avoid strong sensitivity to local breaks from the main trend, the acceleration factor step is often set to 0.01.

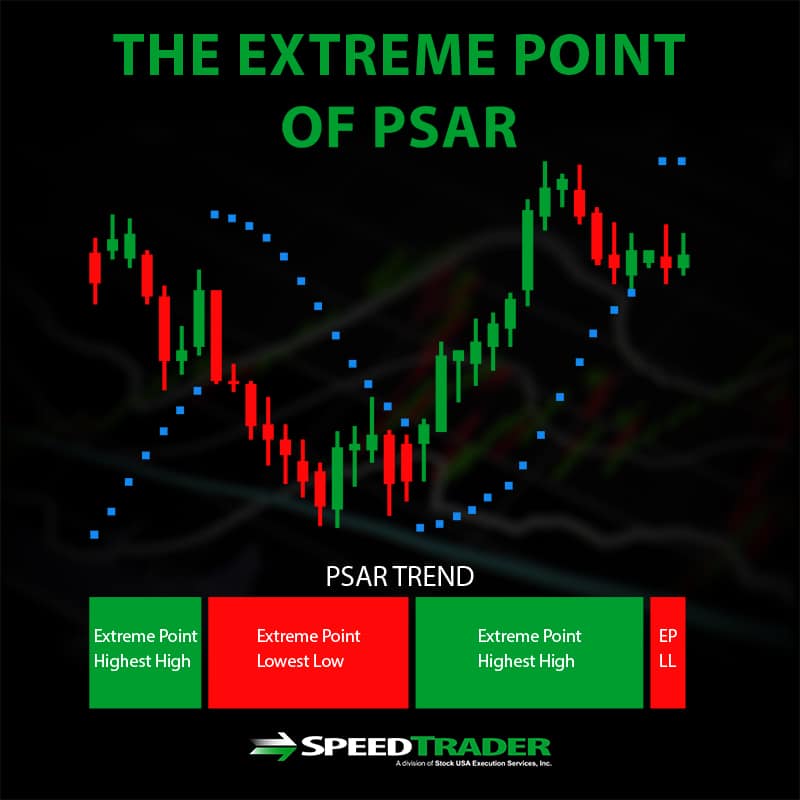
Extreme Point
The extreme point is the highest high of an uptrend and the lowest low of a downtrend. The difference between the previous extreme point and the previous PSAR is the value that is multiplied by the acceleration factor to determine the change in PSAR with each round of calculation. Thus, a larger deviation in the extreme point from the PSAR will result in a larger movement of the current PSAR towards the current security price.
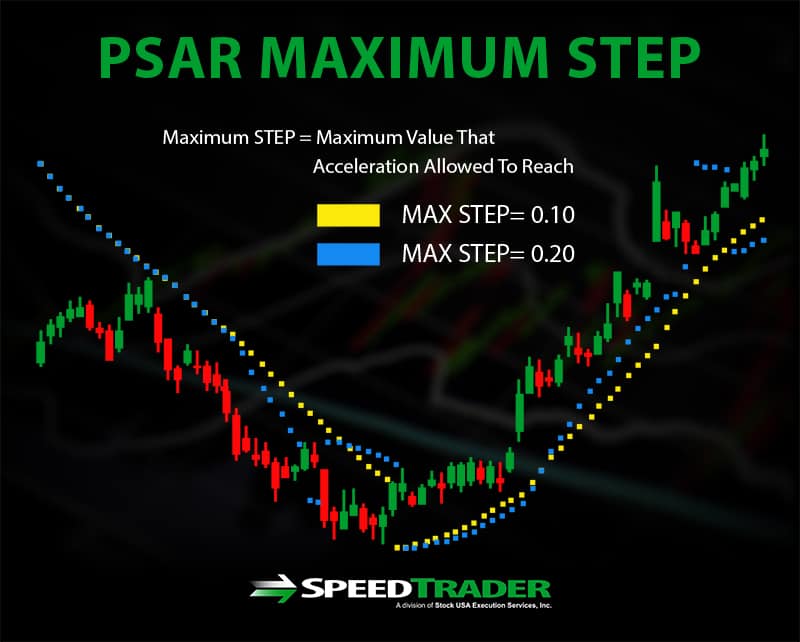
Maximum Step
The maximum step is the maximum value that the acceleration value is allowed to reach. That is, once the acceleration reaches the maximum step – typically set to 0.20 – it will remain at that value until the trend reverses and the acceleration factor resets to its initial value. A lower maximum step makes the PSAR less likely to signal a reversal, since it limits the acceleration on the PSAR, while a higher maximum step can make the PSAR more likely to signal a reversal.
How to Trade the PSAR
The most obvious use of the PSAR is to identify when a reversal in a price trend might occur – and to buy or sell accordingly. In this case, the entry point for purchasing a security is identified when the PSAR crosses below the security’s price, and the exit point is when the PSAR crosses above the security’s price. However, it is wise to combine the PSAR with other technical indicators to confirm the signaled trend reversals and to more narrowly determine entry and exit points.
The PSAR can also be used to indicate at what prices to place trailing stop-loss orders. This is because in an uptrend, if a security’s price drops to cross the PSAR, what might otherwise be seen as a local dip in the uptrend may in fact be likely to reverse to a full-blown downtrend – at which point selling is desirable before the price drop continues further. In this case, the stop price could be set at or just below the PSAR value and adjusted as the PSAR value changes with time.
Summary
The PSAR – parabolic stop-and-reverse – indicator is plotted on a price chart and is intended to signal when an uptrend or downtrend in a security’s price is about to reverse. The signal comes when the PSAR itself crosses above – a sell signal – or below – a buy signal – the security’s current price. The accuracy and sensitivity of the PSAR depends on several variables, the most important of which are the acceleration factor, its step increment, and the maximum step. When used effectively, the PSAR can serve as both a reversal signal and a price indicator for placing trailing stop-losses. Since the PSAR can be applied on both intraday and longer timescales – weeks or months – it is a useful tool for day traders as well as active mid-term investors.