
Fundamental Ratios on the Fly
While intra-day traders tend to concentrate on technical analysis, the visual interpretation of price action, long-term investors tend to focus on fundamental analysis, the interpretation of the underlying business. Both types of analysis come with its followers and critics. However, today’s seasoned trader needs to be experienced in both styles. Very similar to mixed martial arts, it’s the hybridization of striker and ground fighters that generate new champions. The same holds true for trading. While one style will likely be the dominant style, it pays to be somewhat fluent in the others as well. Utilizing market statistics is a quick way to use financial ratios and metrics to analyze fundamentals in seconds to minutes. As least enough time, to justify whether to hold or cut loose a position from a fundamental perspective.
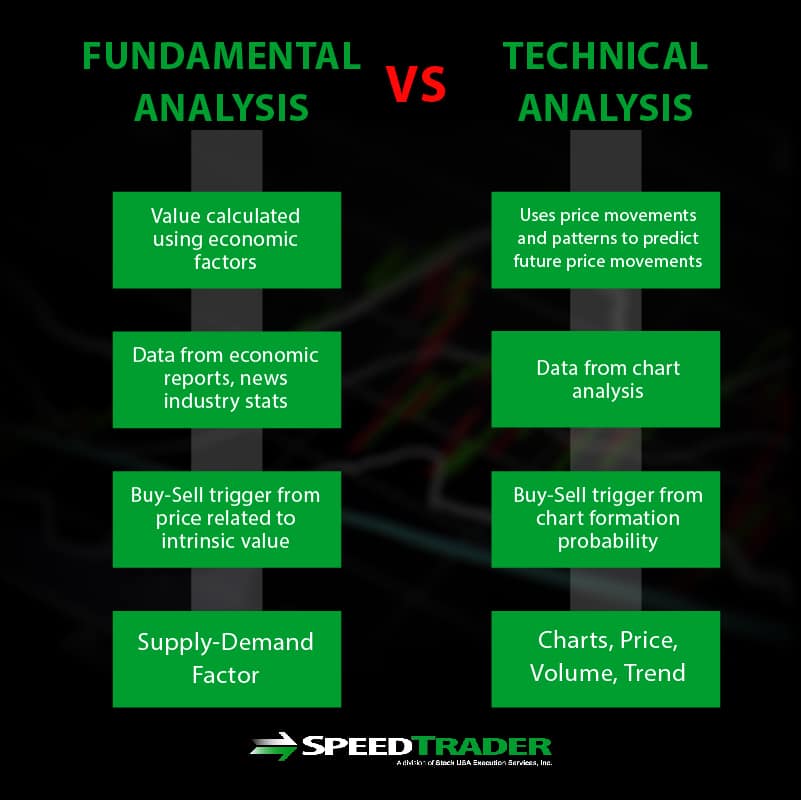
Fundamentals help to understand the catalysts/reasons for a stock price move, whereas technicals illustrate how stock prices move. Usually, there is a connection between the two, but not always. It’s prudent to bolster the basics of fundamentals and the application so that you can understand the complete picture of the why and how a stock’s price moves. It allows you to decide whether a stock’s price move is justified by putting you in the minds of investors as well as traders. You are able to form your own interpretation and contrast to the market’s interpretation to find an edge.
What is an accounting/market financial ratio?
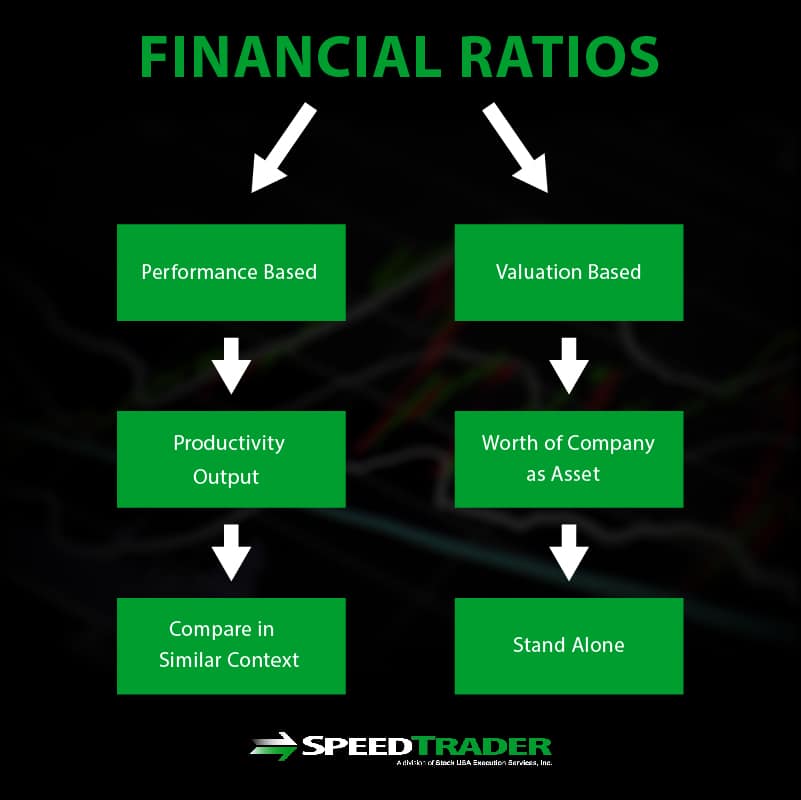
These are common analysis metrics that allow users to quickly compare various financial components of a company to derive some insights on their performance and financial health. These metrics can be compared against peers and industry averages to determine how well the company is performing or under performing in its group. This gives the user a better idea of valuation as well. If the company has impressive metrics while outperforming the major of peers, it could be an undervalued situation that presents more upside than downside. Combining this fundamental analysis with technical analysis can help time good entries for position trades. Financial ratios can be segmented into two categories, performance-based and valuation-based.
Performance-Based Versus Valuation-Based Ratios
Generally a performance ratio measures output/productivity aspects of the company operations whereas valuation measures the worth of various parts or all of the company. The context is the key when comparing the financial ratios like industry or sector. Different industries will have different ranges of what is considered the “normal” metric. For example, the S&P 500 may have a price-to-earnings (P/E) ratio may be 21, but that doesn’t mean XYZ with a P/E of 11 is an undervalued company if the industry average hovers around a P/E of 5. Some ratios can be considered both a performance and valuation ratio depending on the purpose of its use. Performance ratios are most useful when they are compared in a similar context and valuation ratios can be useful as a standalone. However, there will always be exceptions.
Applying Ratios in Proper Context
Valuation ratios can be used as a standalone when trying to determine if a specific company could be trading at a deep bargain to the market This is illustrated when using a valuation ratio like cash-per-share (CPS). If the CPS of stock XYZ is $6.50 but the stock is trading at $5.50, it implies the company is undervalued. In essence, it is trading below cash value meaning the business itself is free. It implies that even if the company were sold off at market value at $5.50, there would be $1 per share in cash left for the owner. However, in these rare situations, there may be a good reason it is trading under cash value, like massive debt. If there is negative $10 per share in long-term (LT) debt minus the $6.50 in CPS, it still leaves negative $3.50 per share in LT debt, leaving $2 per share for the valuation of the business. This extremely watered down analysis illustrates that the shares are not undervalued.
Commonly Used Market Statistics and Ratios
Most of these can be found on trading and research platforms and for free on value search engines and financial sites.
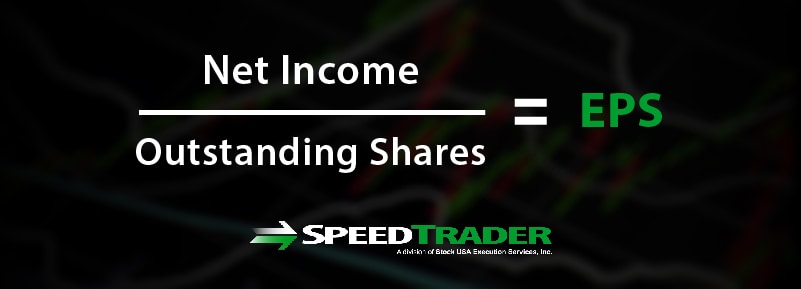
Earnings Per Share (EPS) is one of the most commonly referenced and impacting performance ratios for any company’s stock price. This metric divides the net earnings by the number of shares for the quarter or year to derive the EPS. The EPS is compared against consensus analyst estimates to gauge performance. Based on how well the company beat or missed the EPS estimates combined with the forward guidance (raise or lowered), the stock price will react with dramatic price swings.
Price/Earnings (PE) is a widely used valuation ratio that divides the stock price by the earnings. Every sector and industry tends to have an average and median PE ratio. Loose comparisons to the industry norm can give you an idea of over or under valuation and how the company stands amongst peers in the sector. Companies that don’t generate a profit don’t have PE ratios but many will use a forward-looking profit based on projections to derive a forward PE ratio. Be aware of the sector/ industry average PE ratio first.
Price/Earnings Growth (PEG) ratio is a valuation metric that measures the company’s growth rate. It should be compared to the industry/sector peers.
Book Value (and/or Price/Book Value) or BV is a valuation metric that can be compared to industry/sector peers to gauge under or over valution. In extreme cases when a stock is trading below its BV, there may be a trade for a reversion back to that stock price.
Beta is a volatility metric that illustrates how volatile the stock trades compared to the S&P 500 index. A beta of 1 means it moves identically percentage wise. A beta of 2 means the stock price historically moves twice the percentage moves of the S&P 500, so if the S&P 500 index is trading up by 2%, then a stock with a beta of 2 would normally be trading up by 4% higher on the day.
Short Interest (Short % of Float) is a metric that gauges the negative sentiment in the stock and the susceptibility for a short-squeeze. Typically stocks that have a short interest above 30% are very ripe of short-squeezes on any positive catalyst including earnings, news, regulations, FDA approvals and court judgements.

Insider Ownership is a ratio that illustrates how much “skin in the game” the management has. If insiders own a larger portion of shares, it can mean they are more aware of raising shareholder value, but it can also be more susceptible to manipulation as well. While insider ownership is good, too much (over 50%) can stifle growth and convey a state of complacency. Stocks with too much insider ownership can also be very volatile and lack stability from the lack of liquidity.
Institutional Ownership is a ratio that shows how much of the company is owned by long-term holders. High institutional ownership tends to provide more stability for the stock, as institutions will support price levels. However, the repercussions of poor performance can be larger resulting in big price gaps down as liquidity thins out.
Dividend Yield is a ratio that illustrates the percentage of annual yield provided by the quarterly dividend distribution. Value investors seek out high dividend yields, however, this can be a Catch-22 situation. If the share price drops, the dividend yield naturally rises. Poor stock performance can increase the dividend yield percentage, however, continue poor performance can result in the company cutting their dividend distributions altogether. Lower dividend yields result from rising stock prices. The question boils down to whether the rise or fall of the dividend yield can be offset by the movement in the underlying stock price. Longer-term investors are usually the most concerned about dividend yields.
Share Structure identifies the type of shares available to be traded. Authorized Shares is the maximum number of shares that can be issued by a company. This figure includes shares that have not yet been issued. This amount is set as a reserve for future shares to be issued in cases of private placements, secondary offerings and other processes to generate more working capital. Outstanding shares include all the shares that are available to trade including treasury stock, shares held and trading. The Float represents the free trading shares that are not restricted or held by beneficial owners, insiders or institutions. In essence, this is what is available right now in the markets to trade. Smaller floats have less liquidity and have wider spreads and more volatile price action.