
What is a Broader Market?
The broader market is a term used to describe the performance of a larger subset of the stock market to get a snapshot of overall performance. Usually, they are segmented into indices that include the largest and most widely held stocks on the U.S. exchanges. Many indices are organized by a common theme like sector-based or market capitalization-based.
These indices/indexes are often used as a comparative to an individual or group of like-themed stocks to gauge relative performance (outperforming or under performing) compared to the broader market. For example if a stock is trading up 11 percent on the day while the S&P 500 index is trading down –2 percent, then the stock is over performing the broader markets.
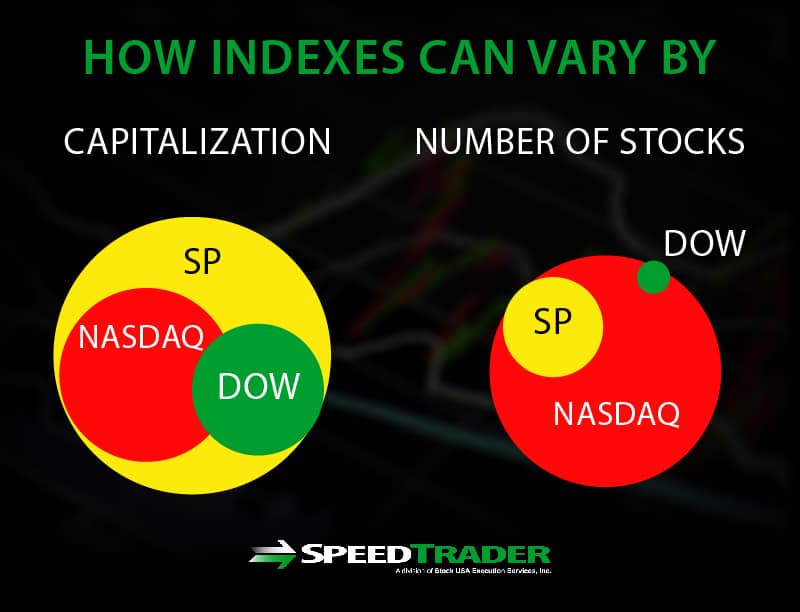
The most popular broader market indices are the S&P 500 index (large-caps), The Dow Jones Industrial Average (30 large-cap industrials), Nasdaq Composite (technology stocks) and the Russell 2000 (small-caps).
What is an Industry?
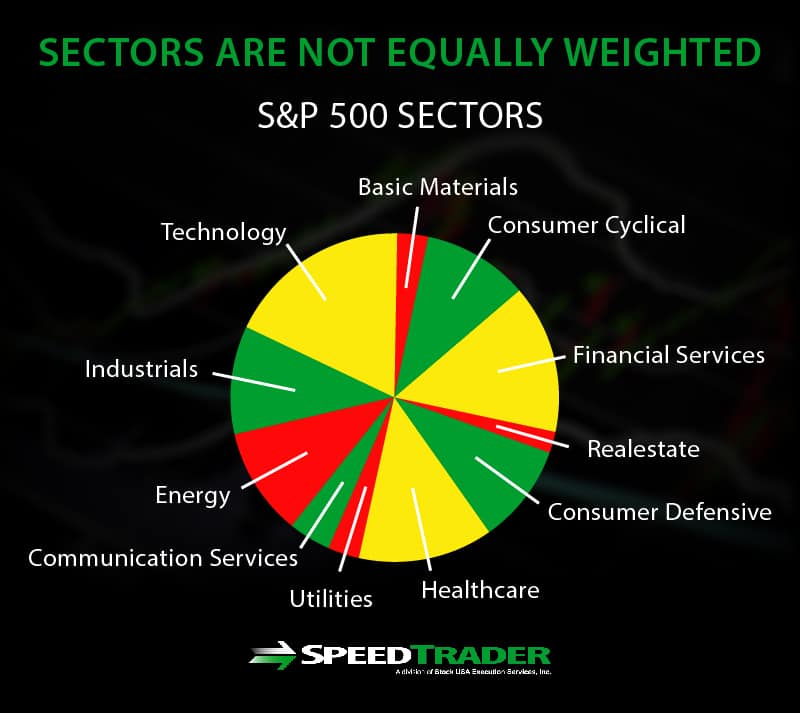
The stock market is segmented into economic sectors. Sectors represent a set of businesses that provide products or services sharing the same theme. There are 11 sectors that compose the markets: energy, materials, industrials, consumer discretionary, consumer staples, health care, financials, information technology, telecommunication services, utilities and real estate. Within these sectors, there are subsets of like business that make up an industry. For example, the financial sector has different industries including banks, insurance companies, credit card issuers, and mortgage companies. The health care sector includes industries like pharmaceuticals, biotechs, health insurers, medical equipment makers and hospitals.
Why Broader Markets and Industry Trends Matter
The broader markets paint a general perspective and sentiment of the U.S. economy represented by the performance of the overall stock market. The Dow Jones Industrial Average is often referred to as the “market”. However, since it is composed of only 30 stocks, many investors prefer an even broader market index like the Standard and Poor’s 500 (S&P 500) index. The S&P 500 index is composed of up to 500 stocks spanning every U.S. financial sector and industry. The component stocks are usually the largest capitalized companies and most well known in their industry.
Relative Strength and Beta
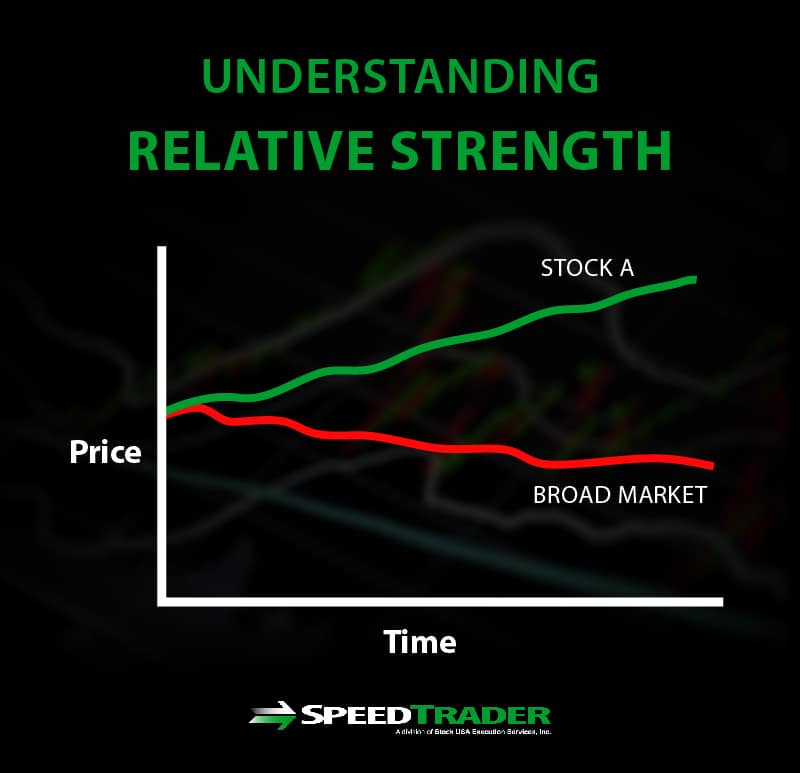
While the broader markets may indicate weakness, there may be sectors or industries that are indicating strength at any given time. If investors only focused on broader markets, they wouldn’t be aware of the outperforming industries or sectors. Therefore it’s important to understand that the money flow tends to rotate between sectors, industries and individual stocks on a daily basis. If a stock is trading up while the broad markets are trading down, it is displaying relative strength. Usually, this is due to a fundamental catalyst like news, earnings reports, rumors, events and regulatory decisions.
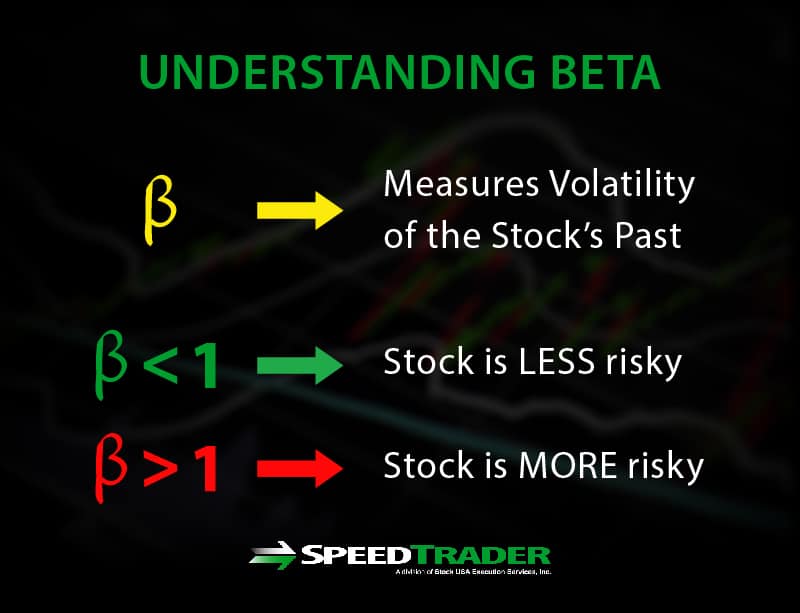
Stocks that normally trade in the direction of the broader markets tend to have a low beta. The beta indicates how closely the stock tends to move with the S&P 500. Therefore a stock with a beta of 2 means it tends to display twice the volatility of the S&P 500. When the S&P 500 index or SPY, the exchange-traded-fund (ETF) representing the S&P 500, rises 2% on a trading day, most stocks will trade higher as well.
Industry Trends
Not all sectors or industries perform equally. Within the S&P 500, you will find some sectors and industries are greatly outperforming others. Traders who want to be where the action is can study the heat maps that show where the best performing sectors and industries are on any given day.
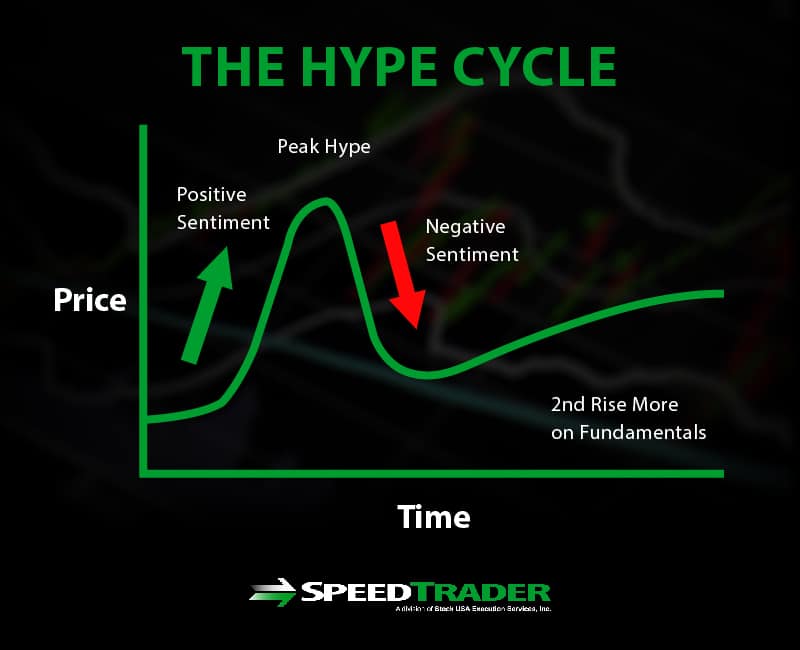
It’s important to remember that markets move on sentiment, however, sentiment may not necessarily be reality. For example, cloud computing, virtualization, fuel cells, solar energy and marijuana industry stocks all experienced parabolic price spikes due to overwhelming positive sentiment in the past decade. However, reality eventually set in when earnings reports indicated that the markets got ahead of themselves causing the stocks to collapse from their highs. Therefore, it’s imperative to know at what point in the hype cycle the underlying stocks are trading. Industries also allow for the sympathy trades where the expensive lead industry stock is trading very strong allows for prudent traders to buy the lower tier stocks in anticipation of bargain hunters looking for a cheaper peer to follow.
How to Track Broader Markets and Industry Trends
Up until the creation of ETFs, traders and investors could only track the indices but couldn’t trade them unless they purchase every stock in the index. However, the creation of ETFs allows traders to not only track the performance, but also trade the indexes like a stock. These can be traded directionally or used as a portfolio hedge.
ETFs and Indexes
It’s best to stick to the most well known ETFs with the heaviest daily trading volumes to ensure liquidity and less slippage from wider spreads. The most widely traded broader market ETF is the SPY, which tracks the S&P 500 index. Trading Software lets you track the ETFs as well as overlap an ETF chart with a stock pattern to gauge how well they are converging and most importantly, spot the divergences for potential reversion trades.
How to Apply This to Your Trading
The broader market ETFs are a great compass to gauge how the overall markets are performing relative to whatever stock you are trading. If you are trading a stock with relative strength (trading up) while the SPY is down. You can time your exits and entries using the SPY as a leader indicator. For example, if the SPY starts to bounce, it should be a tailwind that makes stronger stocks even stronger. This gives you an opportunity to enter a long position ahead of the SPY bounce to profit on the magnified bounce. On the flipside, if you are already long, you can lock in profits into much better liquidity as the SPY rallies.
Use the SPY or any other applicable broader market ETF as a lead indicator for your stocks to gain the extra edge to help time your entries and exits. As a general, if the broader markets are strong, then the path of least resistance is to play on the long side and when markets are weak, play on the short side.