What are Fibonacci Retracements?
A Fibonacci (fib) retracement is a support and/or resistance price level that is calculated by applying key Fibonacci ratios to a pre-selected price high and low range. Stock prices tend to pullback or retrace to one or more of these fib levels before resuming or reversing the trend. When plotted correctly, the “fib” levels can be uncanny in their accuracy and effectiveness for catching tops and bottoms. They act as inflection points, where the stock will either deflect off the level or break through eventually, almost like a speed bump. When the fib levels converge with other indicators or have overlapping price levels, they become extra powerful levels.
Significant Price Points
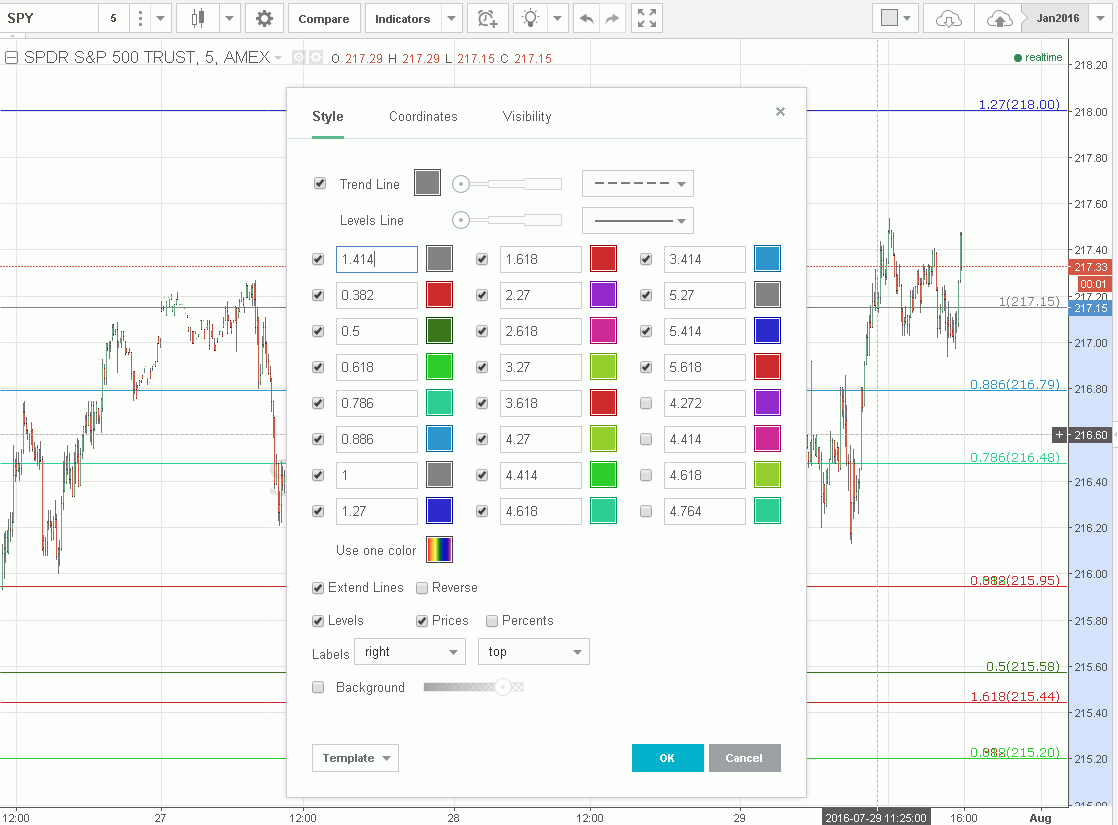
The most significant price ratios to use are the 0.382, 0.50, 0.618, 0.786 and 0.886 and then 1.27, 1.414 and 1.618 for extensions. These 8 Fibonacci ratios tend to have the most effectiveness. Of the fib ratios, the 0.618 carries the most weight, as it is the golden ratio, as in 0.618, 1.618, 2.618, 3.618 and so forth.
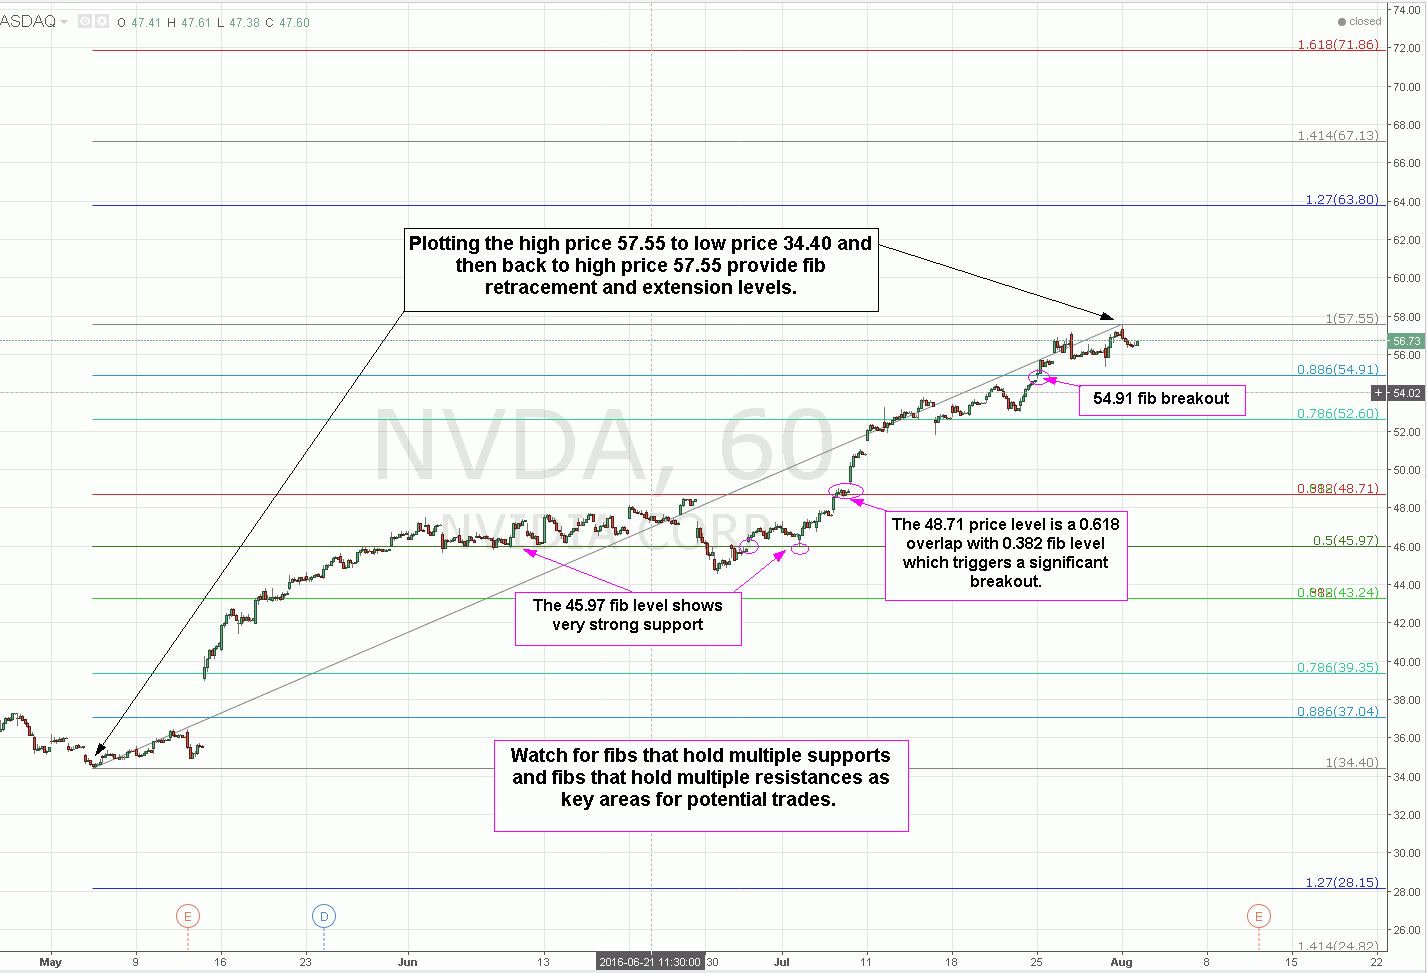
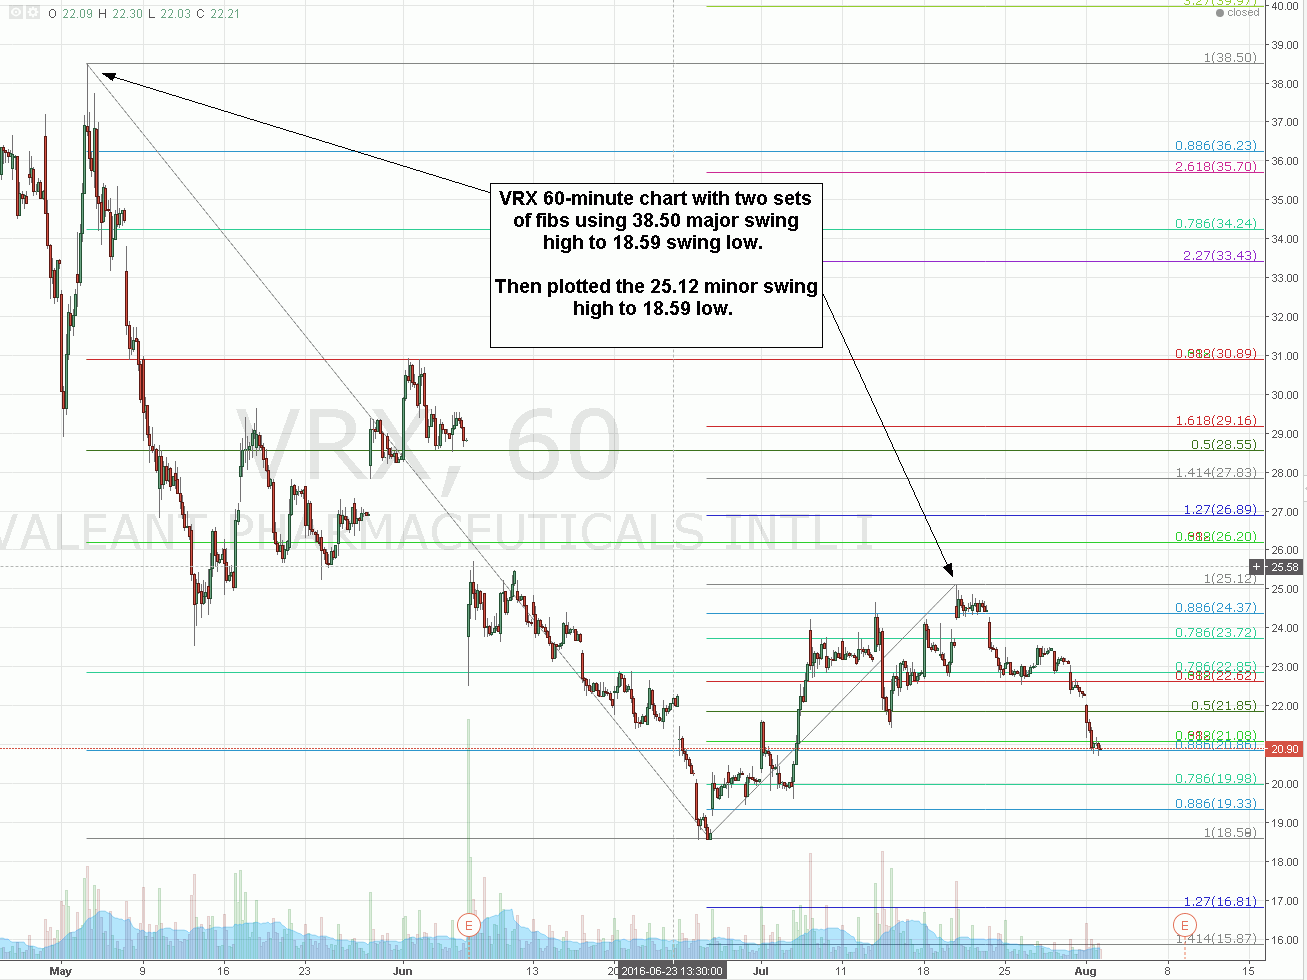
When fib lines are plotted from high to low and back up from low to high, the 0.618 and 0.382 fibs tend to overlap each other. These double fib levels should always be noted as they can be some of the most powerful fibs in effect.
How to Plot Fibonacci Retracements on a Chart
Depending on your charting platform, you may or may not have the ability to plot Fibonacci retracements in both directions, meaning from high to low AND low to high. Most charting software will allow plotting only the fib retracement for one direction (high to low or low to high, but not both).
Here is the quick step-by-step list once you’ve opened up a candlestick chart:
- Select a stock (or financial trading instrument)
- Select a time frame chart (from 5-minute up to weekly)
- Select the date range (can be days to months). The larger the time frame, the larger the date range should be.
- Plot the fib retracement tool from the highest price of the range to the lowest price of the range, based on the tails and wicks when using candlestick charts.
- Plot the fib retracement tool from the low back to the high of the range
- This should generate two sets of horizontal fib price lines.
When To Use Fibonacci Retracements
Once you are able to seamlessly plot fib retracements, they can be used just like an indicator on all your trades. To avoid having too many lines and indicators, you can opt to stick to a specific time frame like a 60-minute chart. This will contain a year’s worth of price range. The ideal fib ranges will be plotting a high to low and low to high points using the weekly charts back to 2009. Then the 60-minute chart high to low and low to high. If there range is too wide between fib points, then a 15-minute or 5-minute high to low and low to high can be used. Be careful not to have too many fib lines.
How to Trade Fibonacci Retracements
Fib levels are can used as target areas for entries and exits. Since these are inflection points, you can expect some type of price action/reaction as the level approaches. Utilizing the history and make sure to note which fib levels the stock prices tend to hold the support or resistance consistently. These are no coincidence. Utilize a momentum indicator like stochastic, MACD or RSI to time entries and exits. As with any indicator, nothing is perfect. However, as you get more comfortable with plotting fibs, the results can seem uncanny at times as fibs often are significant bounce and rejection price levels. Practice makes perfect.
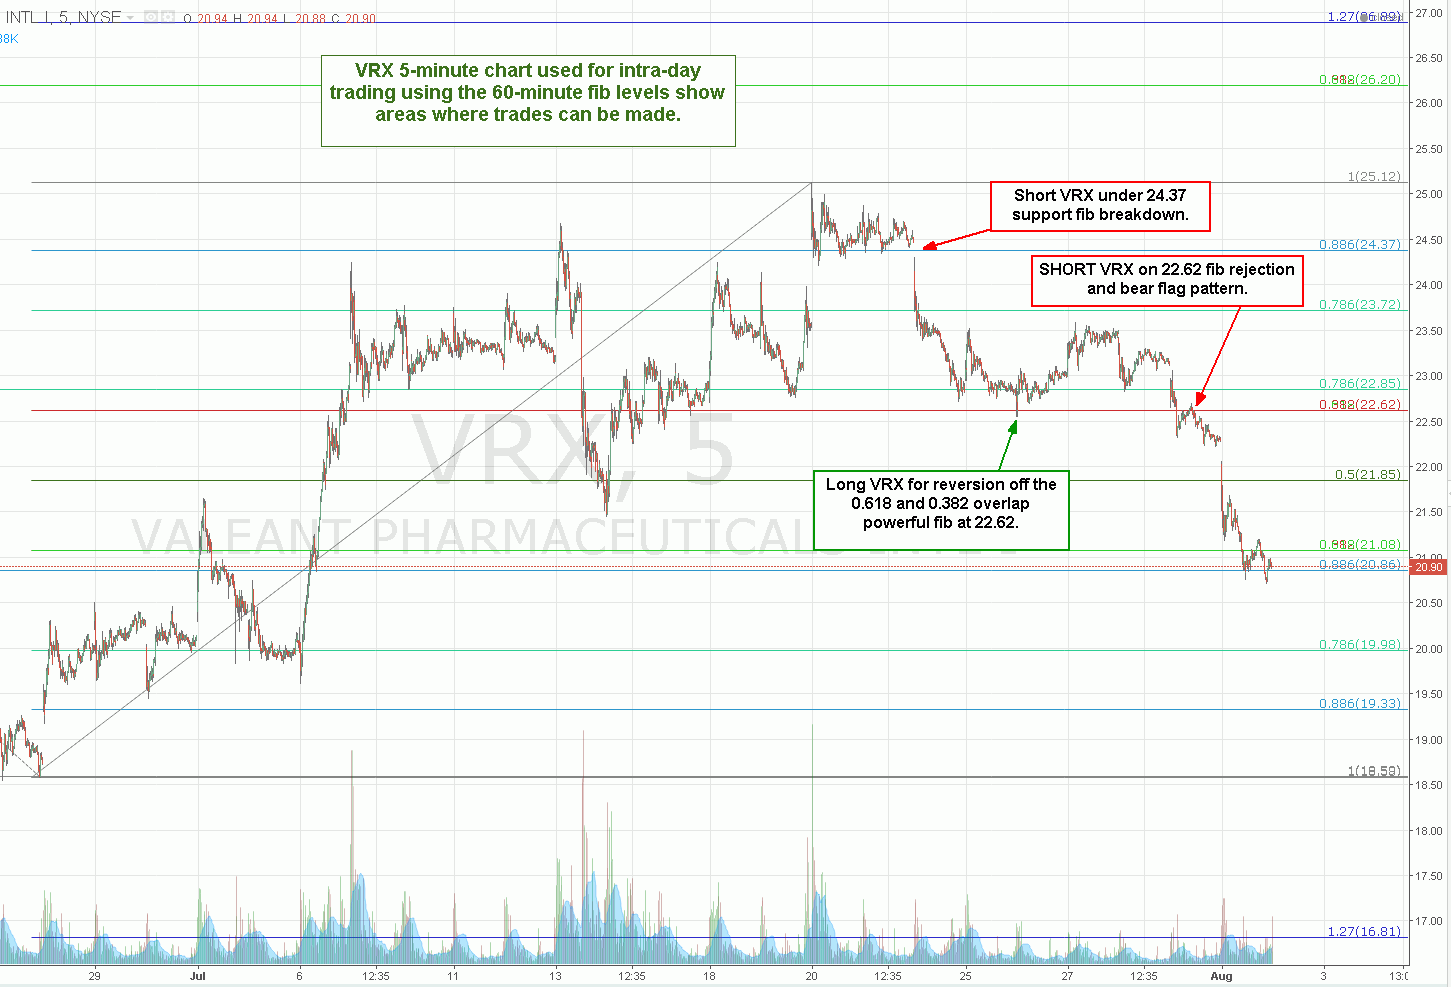
The fib price levels were created on the 60-minute time frame chart. This chart is simply viewed on the 5-minute chart, which still contains the 60-minute fib levels. The reason to switch to the 5-minute is to get a more close-up view of the fib levels to trade intra-day. There are three strong trades on VRX based on the fib levels alone, as illustrated in the chart examples. The 0.886 fib at 24.37 held support on four separate tests before the breakdown. This represents a chance to short under 24.37 as VRX sells off all the way down to the powerful 0.618 and 0.382 combined overlap fib support at 22.62. A buy signal triggers on VRX at 22.62 results in a reversion bounce up to 23.60s before falling again. VRX falls under the 22.62 price level on the sharp drop and attempts to regain it on the bounce attempt but fails as it falls back under 22.62. This is also a bear flag pattern that triggers a short-sell under 22.50 which results in a hard sell-off down to the 20.86 price level before another small reversion attempt above 21.08.


