
Moving averages are on of the most popular technical indicators used for both trading and investing. These indicators are relatively simple and can be used to smooth price action. This allows traders to get a clearer view of a stock’s trend for a given timeframe. Using these averages can help eliminate some of the noise created by insignificant fluctuations in a stock. These indicators can also shine light on a stock’s trading patterns.
What are Moving Averages?
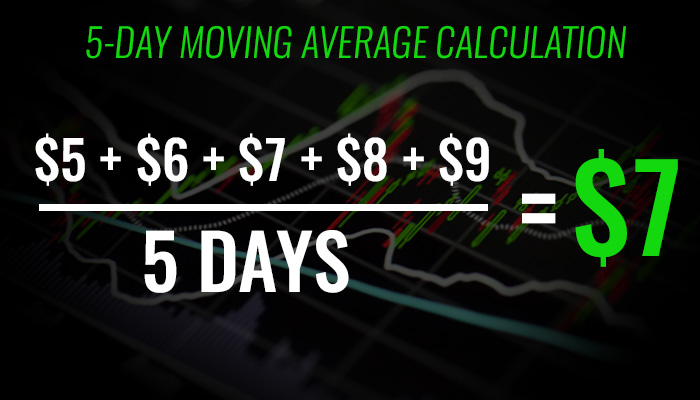
A moving average is simply an average of a stock’s price over a given time period. This is a lagging indicator, meaning it is based on historical price action. Moving averages can be set for different time frames and will often use a stock’s closing price as the basis for the average. So, if a stock closes at $5, $6, $7, $8, $9 for the past 5 days, the 5-day moving average would be $7.
Types of Moving Averages
There are a few different types of moving averages, but the following are the most common.
Simple Moving Average – A simple moving average is one of the most common moving averages. This is the most basic moving average because it simply takes an average of a stock’s closing prices for a given period. So, to calculate a 10-day simple moving average, you would add up the closing prices of a stock for the past 10 days and divide them by 10.
Exponential Moving Average – An exponential moving average is the second most commonly used moving average. The exponential moving average assigns more weight to recent data, whereas the simple moving average assigns equal weight to each piece of data. This means that the exponential moving average reacts much faster when a stock becomes volatile, which can be helpful for traders looking to make faster decisions.
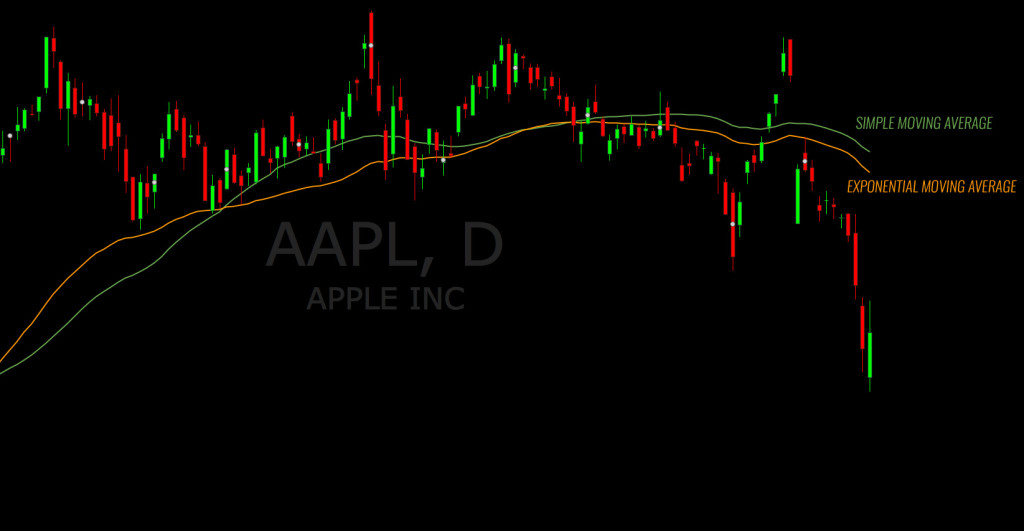
Chart Time Frames
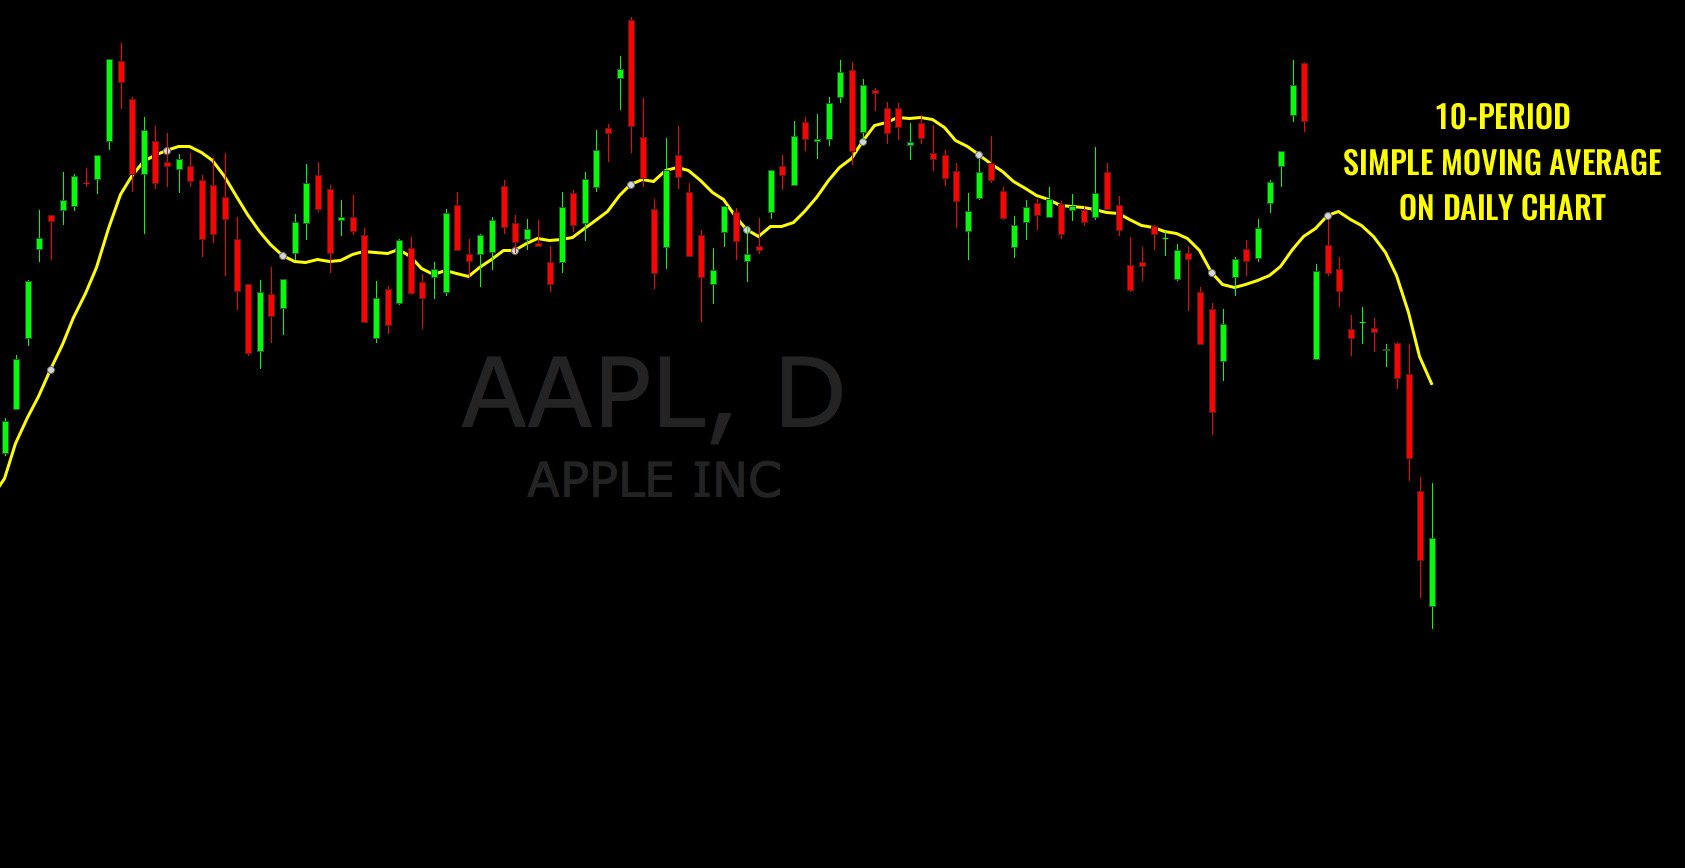
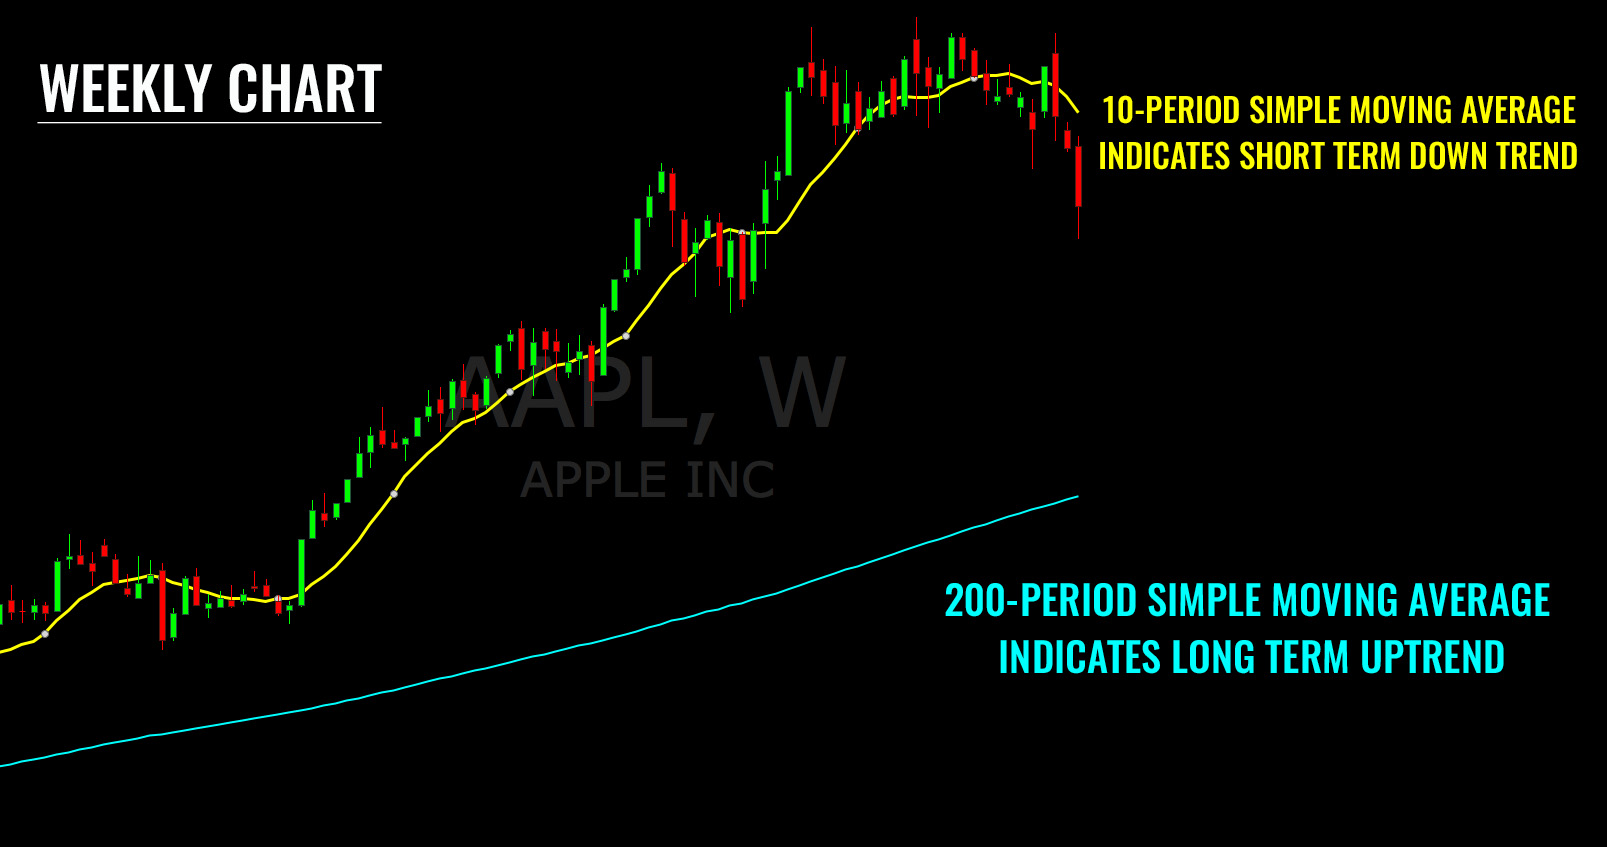
Moving averages can be applied to any chart time frame, including 1-minute charts, 5-minute charts, hourly charts, daily, charts, weekly charts, etc. The timeframe you use these averages on will be relative to your trading style. Some traders may even refer to moving averages on multiple time frame charts before placing a trade.
Popular Moving Averages
It’s important to note that the moving averages you use should be relative to your trading style and your usage of these averages should be purposeful. Traders should not simply use moving averages for the sake of using them. Instead, one should decide if the moving averages will be a beneficial tool for their strategy and incorporate them accordingly.
That being said, here are a few popular moving averages:
10/20 Period Moving Average – A 10-period or 20-period moving average can be used to gauge a stock’s short-term trend. This will smooth out the price action from the past few trading weeks, allowing traders to get a clearer view on the public sentiment surrounding the stock.
50 Period Moving Average – The 50-period moving average is useful for understanding a stock mid term trend (or secondary trend). This can allow traders to look at a bigger timeframe to understand the significance of a stock’s current price.

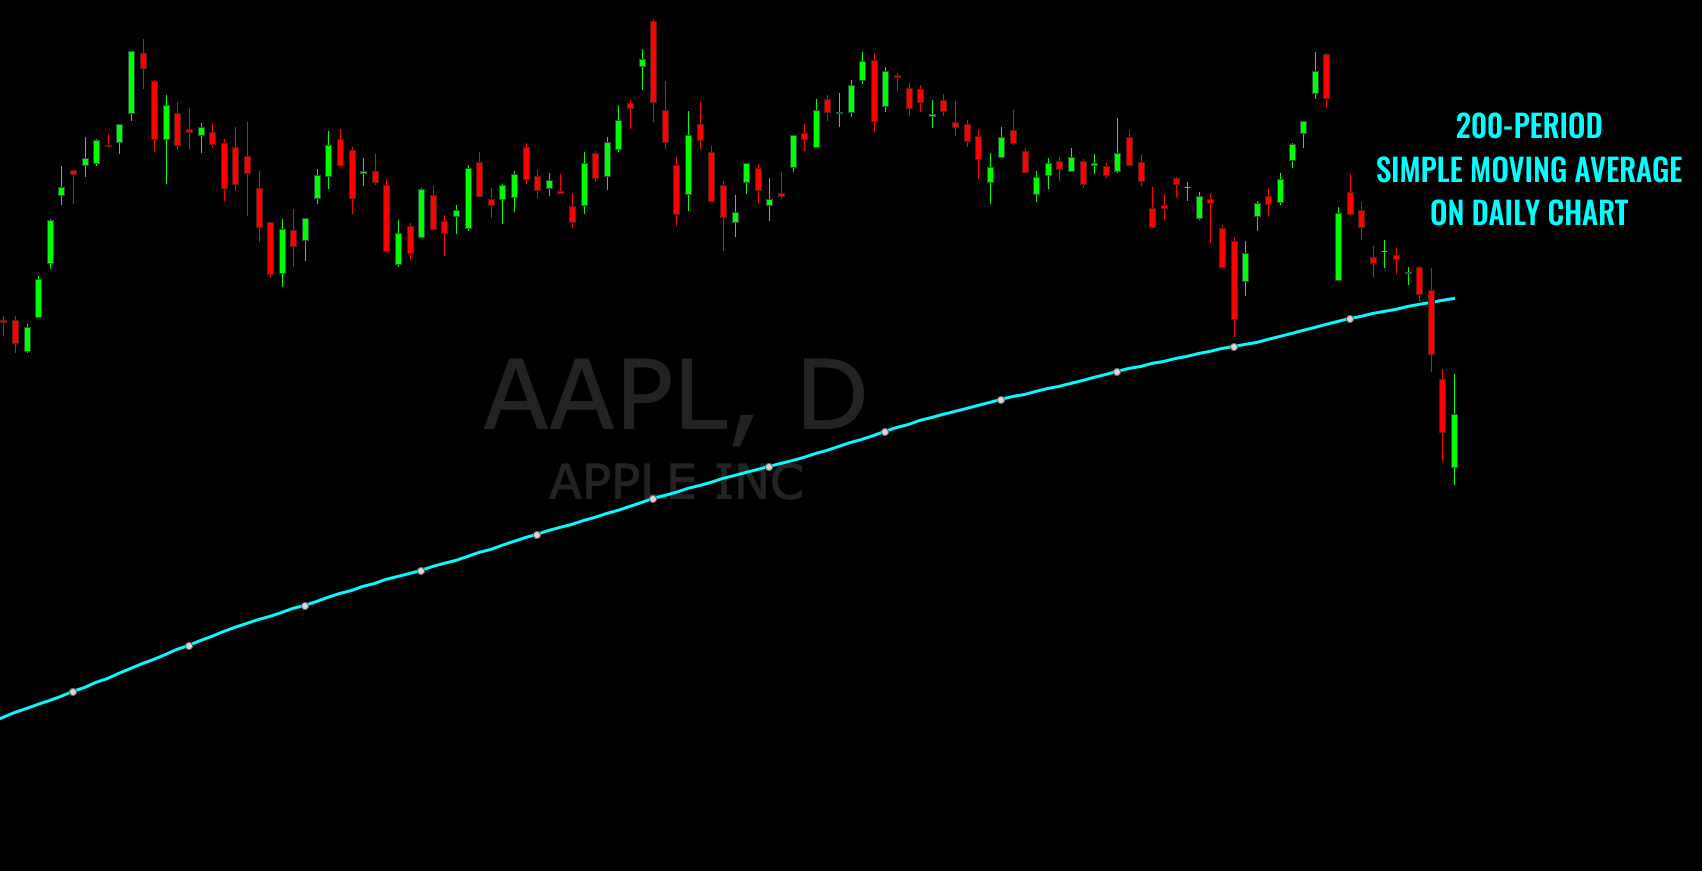
200-Period Moving Average – The 200 period moving average is helpful for understanding a stock’s longer-term trend (primary trend). Analyzing this average can help traders understand a stock’s relative strength or weakness compared to it’s performance over the past 200 periods.
How to Use Moving Averages
There are plenty of different ways to use moving averages. It’s important to make sure your usage of these indicators is actually beneficial to your strategy. The last thing any trader needs is an overabundance of technical indicators crowding their screens. That being said, these moving averages can be very insightful when used properly. Here are a few ways you can apply them:
Identifying Trends – Moving averages can be used to better understand a stock’s trend. A short term moving average may indicate a stock’s short-term trend, whereas a longer term moving average may indicate a stock’s primary trend. This data can be used in a variety of ways. For example, a long-term investor may use a short term downtrend as an opportunity to buy if the stock is holding its long-term uptrend.
Support/Resistance – Significant moving averages (such as the ones discussed above) often become areas of support and resistance for a stock. For example, a stock with a long-term uptrend may find support at the 200-day moving average after experiencing a short-term pullback.

Look For Patterns – Not all stocks react to their moving averages in the same way. For example, a 50-day moving average may be a significant support level for one stock but completely insignificant for another. When using moving averages, you shouldn’t apply any universal rules. Instead, focus on finding patterns. If a stock has used it’s 200-day moving average as resistance 3 times in the past year, that may be a good place to short the stock. That being said, another stock may break through its 200-day moving average with ease. Focus on finding patterns relative to a particular equity and make trading decisions accordingly.
Strength/Weakness – Moving averages can be used to gauge a stock’s relative strength or weakness for a given period. For example, if a stock is trading below its 10-day moving average, it may be inferred that the stock is relatively weak in the short term. Similarly, a stock may be trading way above all of its moving averages, implying that the stock is relatively strong at the moment.
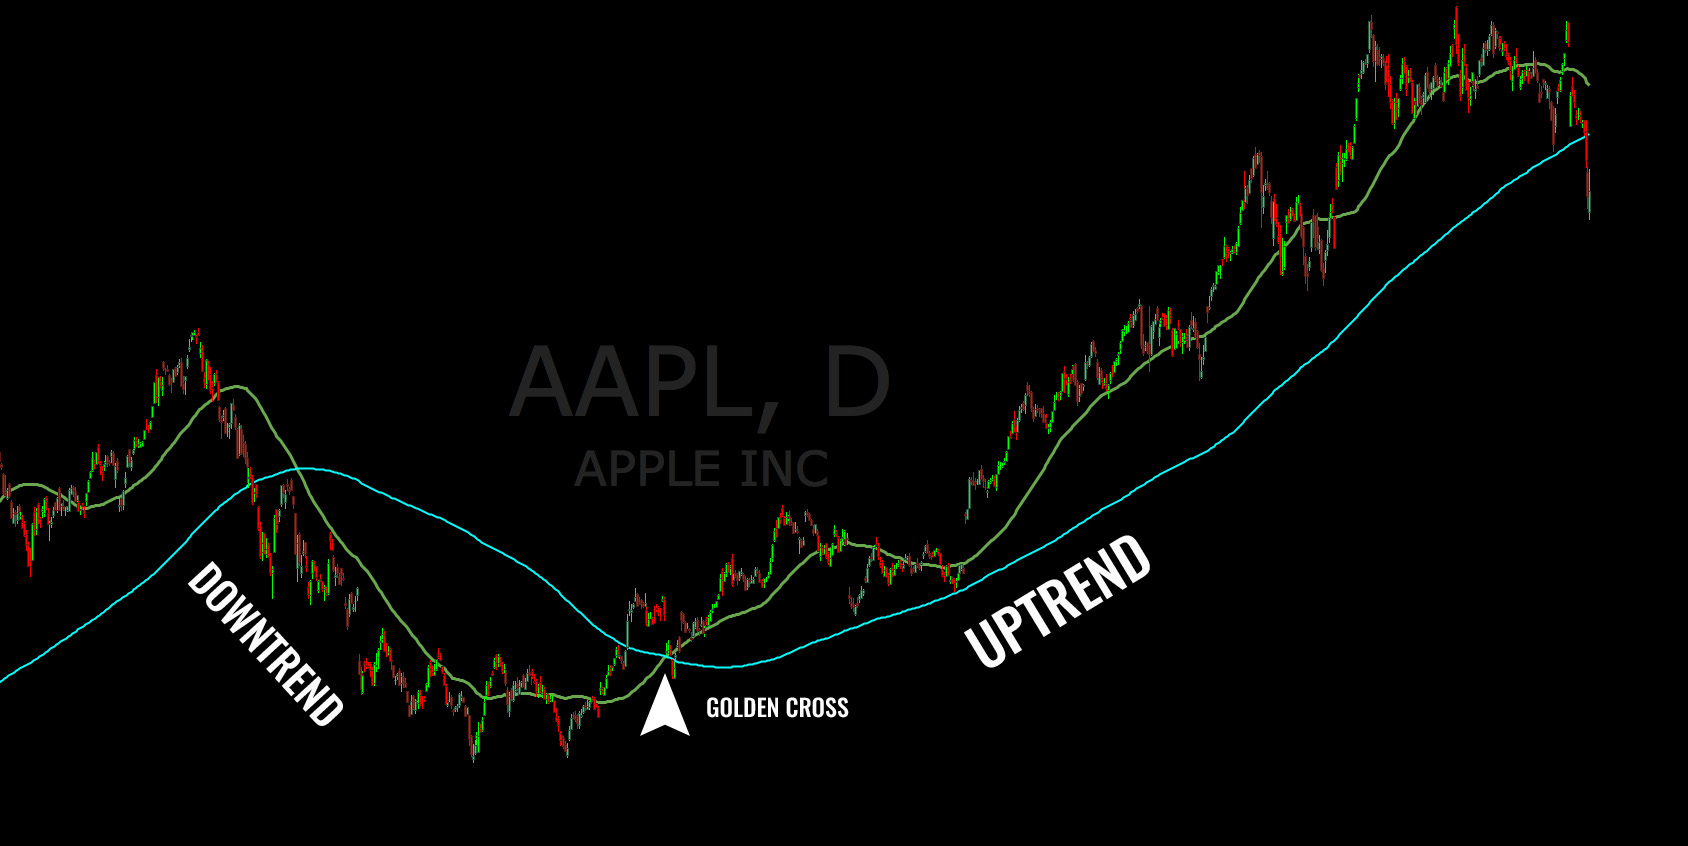
Significant Events – Certain moving average patterns can be used to foreshadow future price action. For example, if a 10-day moving average has been moving down sharply and begins to curl up, it may indicate a change in the short-term trend. Some traders will also use moving average crossovers to predict future price movement. For example, a golden cross occurs when a stock’s 50-day moving average crosses over a stock’s 200-day moving average. This is thought to be a bullish signal.
Main Takeaways
Moving averages are just another tool for making sense of price action in the stock market. These indicators can be helpful for some traders and unnecessary for others. Remember, technical indicators are tools and should be used as such. They should help you accomplish the goal you set out to achieve. You wouldn’t use a hammer unless you needed it and knew how to use it properly; the same logic applies to technical indicators. Focus on how these indicators can help you improve your trading and make sure that you know how to use them properly.