

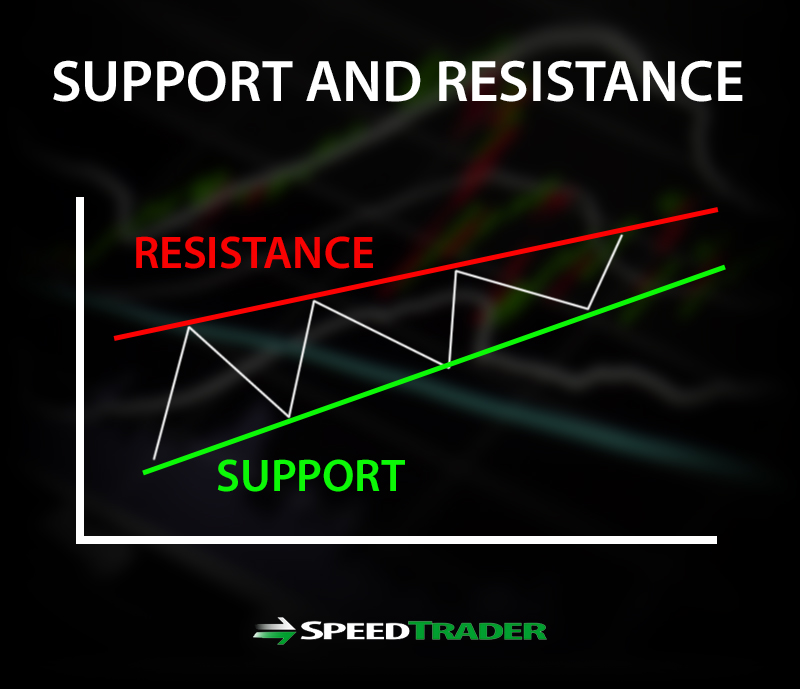
What is Support and Resistance?
Support and resistance are price levels that the underlying stock (or any financial trading instrument) can’t break through or exceed after multiple attempts.
A support level is a price level that a stock can’t seem to fall under due to the oversupply of buyers.
A resistance level is a price level that a stock fails to rise through, due to the oversupply of sellers.
Eventually, when a resistance level does break, it will often turn into a support level. When a support level eventually breaks, it can turn into a resistance level. Being aware of support and resistance levels are key factors that can determine the effectiveness and success of trades.
Confirming Support and Resistance Levels
A support or resistance level is made after it has rejected attempts to exceed them. These levels can be static and or dynamic depending on the indicators used to determine them as well as the time frame interval. Here are a few important things to keep in mind:
- The strength of a support or resistance is increased when there are multiple indicators that overlap near the same levels.
- The more times a support or resistance level is hit, the stronger that level becomes ingrained in the market.
- Even more conviction is gained when volume rises at the support or resistance levels.
- The wider the time frame of the chart, the more significant the support and resistance levels can be.
It is important to gauge the range of the deflections off the support and resistance levels. If the pullbacks get smaller, then a true test and potential break is possible. For example, if XYZ shows a resistance level at $20 but each rejection results in a smaller pullback before another attempt, then the stock may be setting up for a breakout. Strong breaks of resistance levels should result in a trend reversal. The same applies for strong support levels, which should eventually result in a trend reversal back up after testing.
Using Support and Resistance in Your Trading
Awareness of support and resistance levels helps to prepare for better trade entries and exits. It’s akin to having a map of a dangerous neighborhood ahead of time. The trader is better equipped to react at the inflection points to take profits, stop-losses or reverse the trade.
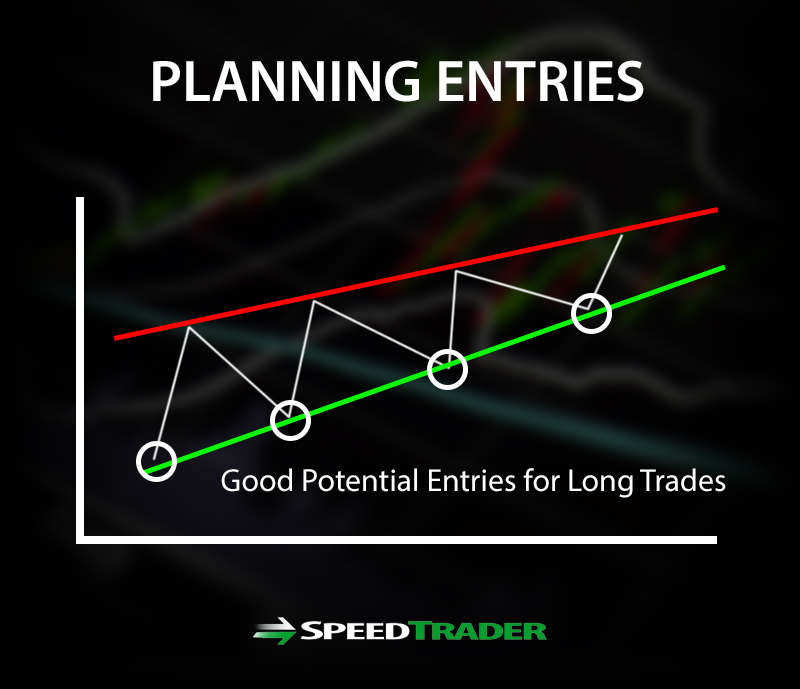
Plan Better Trades
Seasoned traders will usually wait for pullbacks to the support level to enter trades long and use the resistance levels to exit or trim down their positions. Taking a long trade near a support level limits the initial risk on the entry since a stop-loss can be taken relatively cheaper than chasing at the resistance level hoping for a breakout. If the support level manages to break, this allows the seasoned trader to reverse the trade relatively quickly and cheaply. This also applies for short sellers that will enter near resistance levels looking to profit on the price rejection and sell-off. If the price manages to breakout through resistance, the short sellers are usually the first to cover their position and consider reversing to the long side. Resistance levels that breakout can also be traded long for a new or next leg of an up trend. Support levels that breakdown, can be traded short for a new or next leg of a downtrend.
Pinpoint Targets
Support and resistance levels can also be used as target price levels. Just as a trader may enter longs near the support, they can also target the resistance levels to exit longs. A short sale trade near a resistance can target the support levels as the target to cover profits. One trader’s stop can easily be another trader’s target. Traders with the most accurate support and resistance levels are best equipped to take action for minimize losses and maximize profits.
Ways To Find Support and Resistance Levels
With the understanding of how useful support and resistance levels are, the next step is being able to find them quickly ahead of the other market participants. A stock can have multiple support and resistance levels. Some will be stronger than others. Therefore, it is important to establish from the start the two types of support and resistance levels that every stock has.
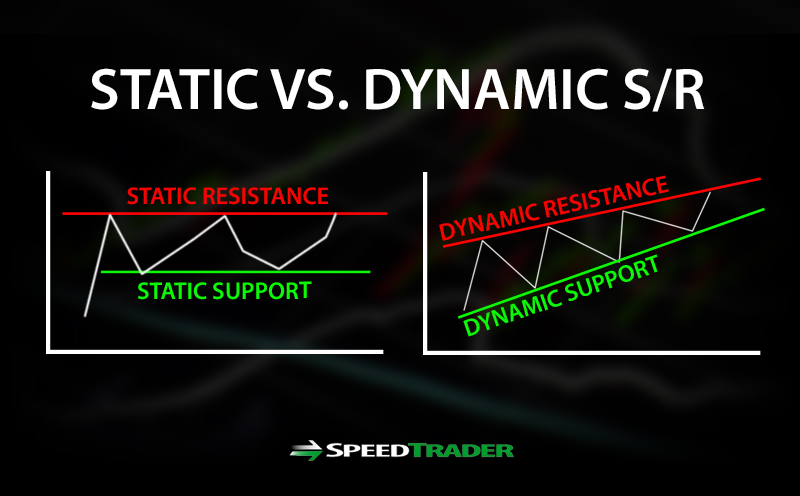
Static and Dynamic Support and Resistance
The two types of support and resistance are static and dynamic.
Static support and resistance price levels do not change regardless of the underlying price activity. Static levels are derived from specific price ratios or historical price formulas and remain in place for the duration of the session.
Dynamic support and resistance levels are more form fitting prices that will adjust with the movement of the underlying stock (or any financial instrument). They key word is adjust. They will adjust higher if the stock moves higher and lower if the stock falls lower. This allows for traders to trail and adjust their profit or loss stops more effectively with the trend.
Pivot Points
Pivot points are static support and resistance levels. They are derived from a formula based on the prior session’s open, high, low, close prices. The actual pivot point can be calculated with this formula:
Pivot Point = (Previous Session High + Previous Session Low + Previous Session Close)/3
Once the pivot point is calculated, then the initial support and resistance levels are calculated:
Resistance Level 1 = (2 x Pivot Point) – Previous Session Low
Support Level 1 – (2 x Pivot Point) – Previous High
Once the initial support and resistance are calculated, then there are four additional levels to be extrapolated to cover the potential full range of movement for the underlying stock.
Resistance Level 2 = (Pivot Point – Support Level 1) + Resistance Level 1
Support Level 2 = Pivot Point – (Resistance Level 1 – Support Level 1)
Resistance Level 3 = (Pivot Point – Support Level 2) + Resistance Level 2
Support Level 3 = Pivot Point – (Resistance Level 2 – Support Level 2)
The pivot points result in six total price levels composed of three supports and three resistances. These levels remain in place regardless of where the stock is trading. These are inflection points that will trigger a reaction. When a stock approaches a pivot point level, the trader should be prepared for either a reversal or a break through the price level. Higher quality trading platforms have pivot point studies that will automatically calculate and plot the pivot points, which is very convenient.
Moving Averages
Moving averages are based on historical trade prices during a specified period and time interval to derive the average price, which is then plotted on a chart. By selecting two moving average lines, a trader can use them as dynamic supports or resistance levels. This prepares the trader to pull the trigger when levels are tested or broken. Longer periods and time frames generate stronger moving averages that tend to get more follow through. The shorter period is always the initial support or resistance. The longer period is the final support or resistance. When the shorter period crosses through the longer period, it signals a trend reversal.
50-Period and 200-Periods: Golden Cross and Death Cross
The two most commonly used moving averages are the 50-period and the 200-period simple moving averages. These are long enough so they don’t trigger constantly. When the 50-period moving average crosses up through the 200-period moving average, it results in a strong up trend also called the Golden Cross. When the 50-period moving average crosses down through the 200-period moving average, the resulting breakdown is called a Death Cross.
Significant Price Points
There are also price levels that are not specifically anchored by chart indicators but are more based on simplistic psychological areas or based on underlying derivative based mechanics.
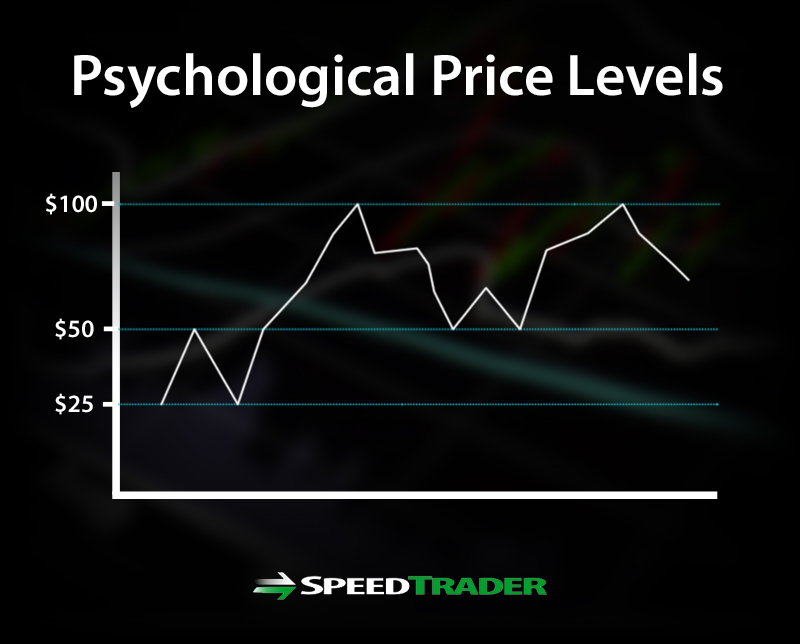
Psychological Price Points
Psychological price levels pertain to levels like $100, $50 and $10 and whole dollar marks. These are simple levels that tend to have a depth of stop orders associated with them. As prices gravitate to these levels, the urge to exit or enter reaches a fever point. Stocks that hit a whole dollar mark (I.E. $8, $10, $15, etc.) will usually trigger some types of stop orders resulting in a volume spike with price break or reversal. The larger the psychological price level, the more significant the reaction should be.
2.50 Price Levels
Options have historically been priced in $2.50 increments up to $100 and algorithm programs have used these levels as inflection points. The phenomenon still exits in the markets where prices reach an inflection point with $2.50 increment levels are tested (I.E. $35, $37.50, $70, $72.50, etc.).
Overlapping Support and Resistance Levels
When support or resistance levels overlap on different indicators, they generate an even more significant support or resistance price level. The reaction tends to be stronger as the level becomes more significant. For example a 50-period moving average that overlaps with a pivot point can be a stronger support level than just the pivot point alone.