
Introduction to Stochastics
The stochastic oscillator was developed in the late 1950s by the trader and technical analyst George Lane. The stochastic oscillator is an indicator similar to the relative strength index (RSI) or moving average convergence divergence (MACD) indicator in that it measures a stock’s price momentum.
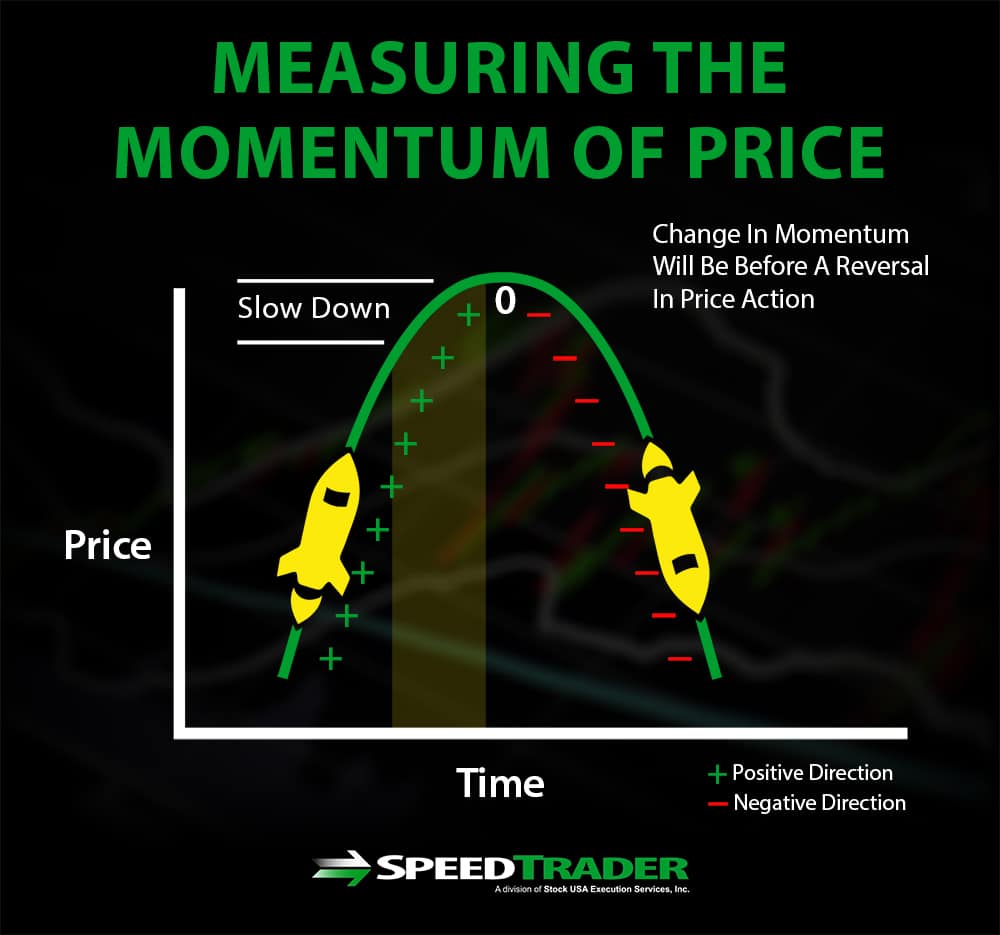
However, unlike the RSI and MACD, the stochastic oscillator is used primarily to gauge shifts in momentum rather than overbought and oversold levels. As Lane himself put it, the “stochastic measures the momentum of price. If you visualize a rocket going up in the air – before it can turn down, it must slow down. Momentum always changes direction before price.” Thus, the stochastic oscillator is designed to capture this change in momentum to predict a reversal.
Stochastic as a Momentum Oscillator
As mentioned above, the stochastic oscillator differs from other indicators like the RSI and MACD in that it does not indicate overbought and oversold levels. A high or low stochastic value does not necessarily mean that a stock’s price is too high or too low relative to its mean.
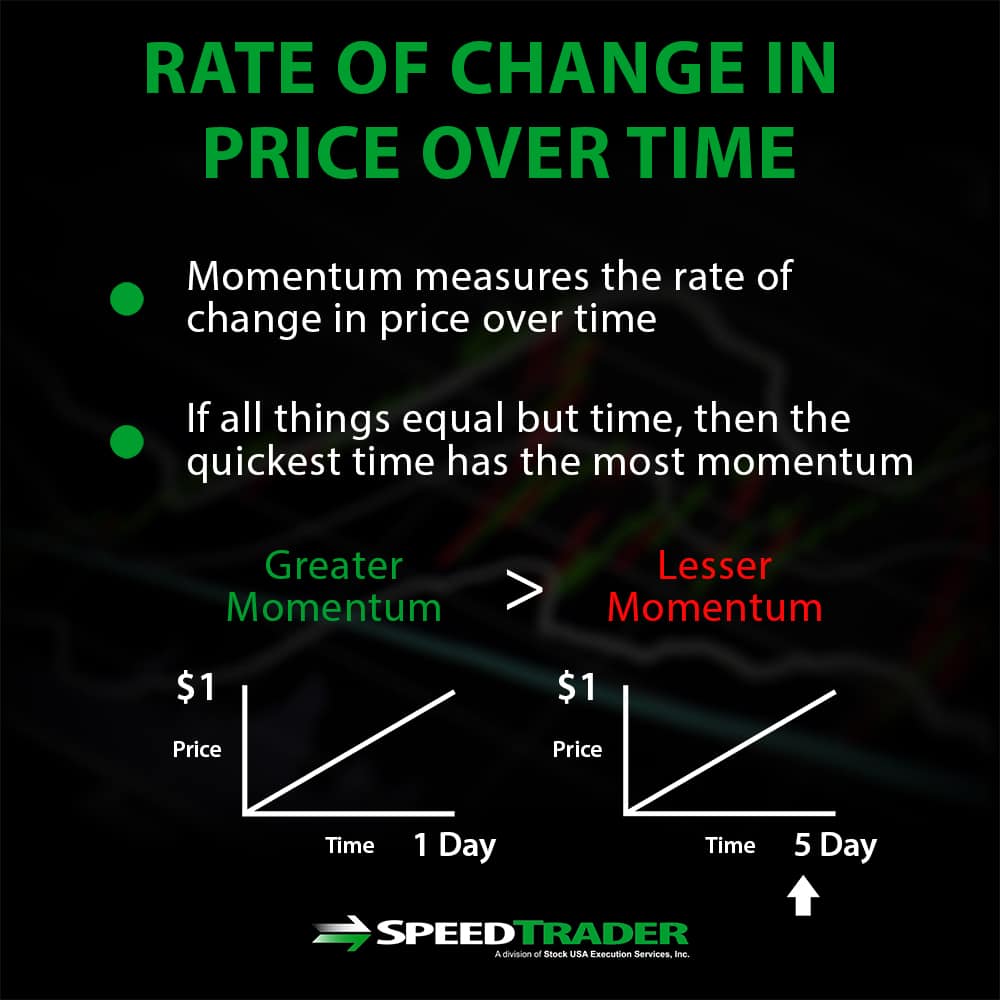
Instead, stochastic operates on the assumption that a change in momentum will always precede a reversal in price action. This fundamental principle that Lane put forward has since been affirmed by numerous other successful technical traders, such as Linda Raschke. Momentum measures the rate of change in price over time – thus if a stock’s price changes by $1 over one day it has a greater momentum than if that $1 change occurred over one week.
Elements of the Indicator
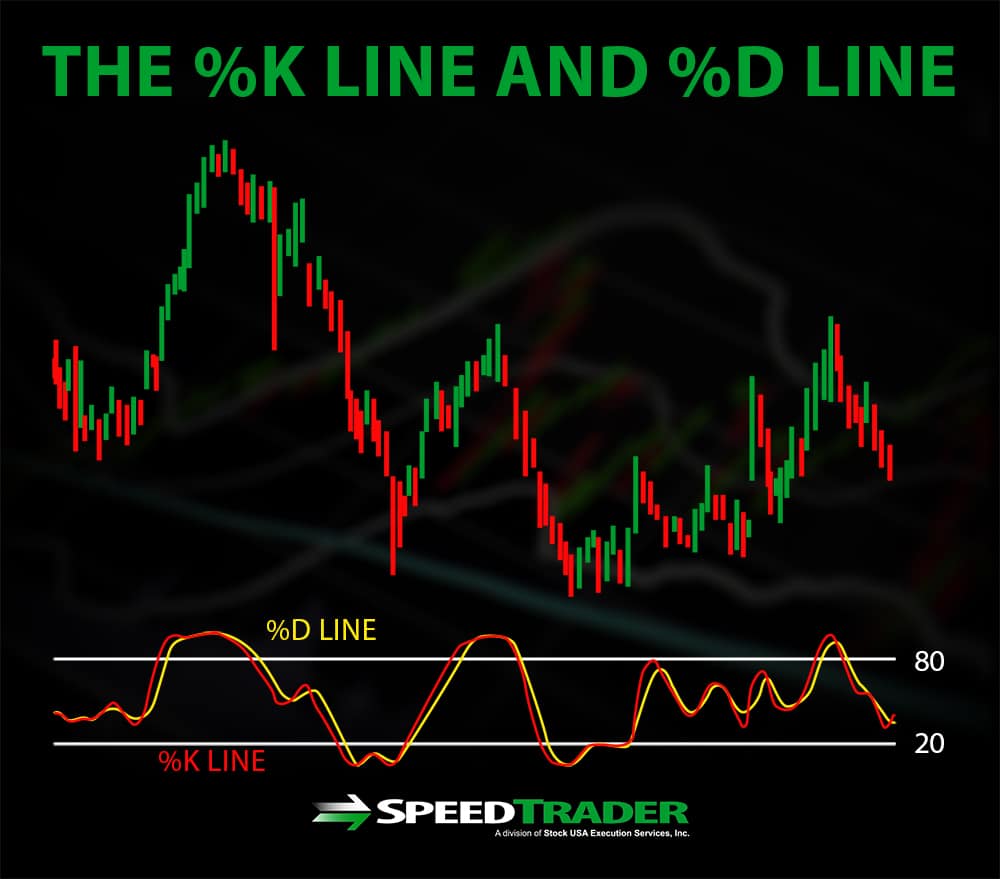
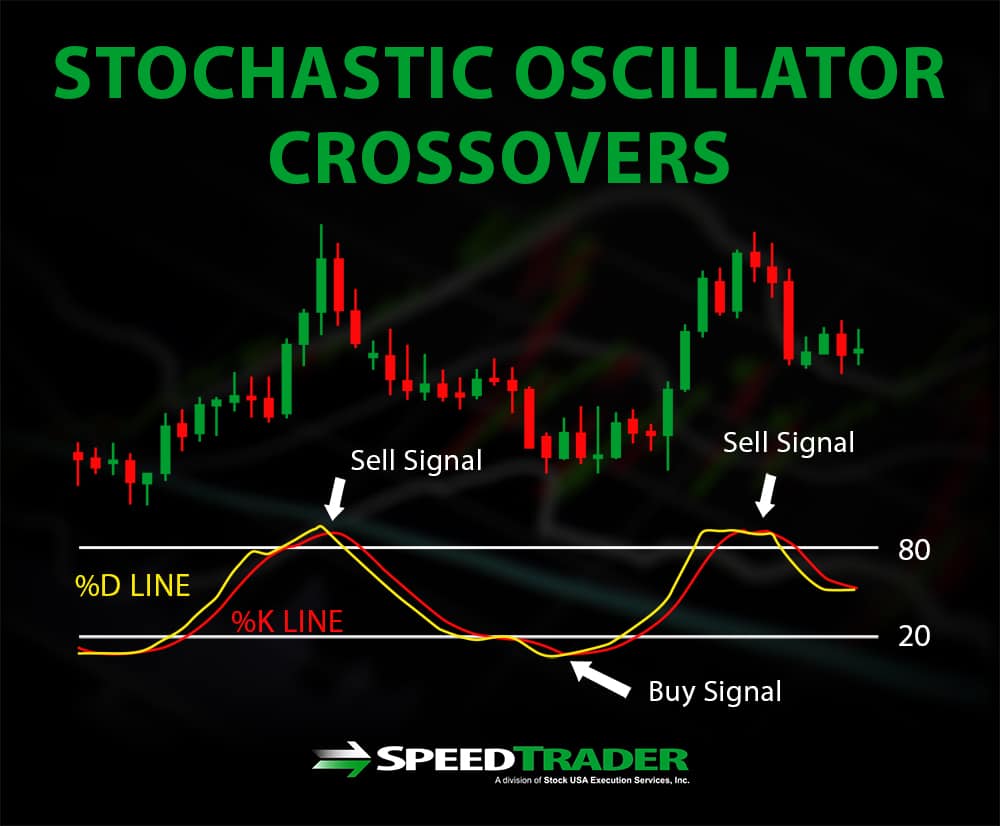
The two essential elements of the stochastic oscillator are the %K line and the %D line. The %K is calculated as the difference between the current close and two-week low divided by the difference between the two-week high and two-week low. The resulting value is then converted to a percentage by multiplying by 100. The %D line is simply a three-day moving average of the %K line. Since the oscillator is a percentage, it is range-bound between 0 and 100.
The timescale of the indicator can also be changed by changing the period used in the calculation. For example, rather than use the two-week (14-day) high and low and the three-day moving average for %K and %D, respectively, it is equally valid to use the 14-month high and low and the three-month moving average.
Crossovers
Many applications of the stochastic oscillator rely on crossovers, which occur when the %K line crosses above or below the %D line, as a trade indicator. When the %K line crosses above the %D line, that indicates that momentum is positive and increasing and triggers a buy signal. Conversely, when the %K line crosses below the %D line, momentum is falling off and a sell is signaled. The consensus among traders who closely watch stochastic oscillator crossovers is that crossovers that occur when the %K and %D lines are closer to the extreme ends of the range – that is, closer to either 0 or to 100 – are stronger trade signals.
Divergence
One of the best uses of the stochastic oscillator is as an indicator for divergence trading and predicting a reversal. Bearish divergence occurs when the stock is setting new highs, but the stochastic oscillator is not simultaneously setting new highs and may even be decreasing moderately – indicating that momentum has slowed and the stock’s upward trend may be about to reverse. Bullish divergence is the opposite, occurring when the stock is bottoming out yet the stochastic oscillator is not setting new lows as well.
Conclusion
The main drawback to using the stochastic oscillator is that it can give false positive signals, particularly when market conditions are choppy and a stock’s price is not trending strongly. In addition, although divergence is typically a good indicator of a forthcoming reversal, the stochastic oscillator does not provide information about the timing of a reversal – the stock price may continue to diverge for relatively long periods in some cases.
Despite these drawbacks, the stochastic oscillator can be a powerful tool for both day traders and active investors since its timescale can be customized. In general, it is best to pair the stochastic oscillator with other technical analysis tool for identifying potential reversals and proper entry and exit points.