If you are a fan of trading indicators, then the following material will suit you. Today we are going to introduce you an indicator which takes into consideration price and volume. Behold the mighty Volume Weighted Average Price (VWAP) indicator!
What is the Volume Weighted Average Price?
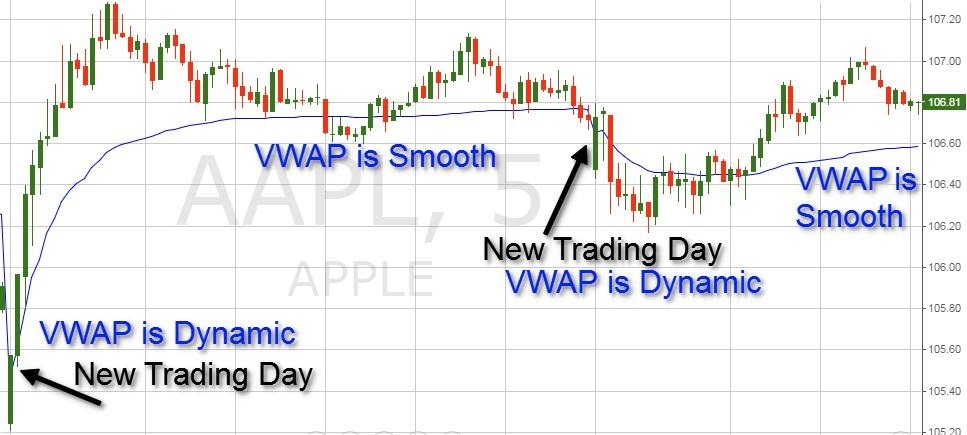
The VWAP is a trading indicator, which averages the closing prices during the given time period. At the same time, it puts emphasize on the periods with higher volume. In this manner, the Volume Weighted Average Price is a lagging indicator, because it is based on previous data. The image below will show you how the VWAP looks on a chart.
Yes, it is a single curved line on the chart. Therefore people often confuse it with a Moving Average. However, you have probably noticed something. See that the further the indicator goes, the smoother it is and it reacts less to price moves. The reason for this is that it gives the average price value during the trading day. The later in the day we are, the more periods the indicator has averaged and the bigger pressure it would need in order to do a move.
Volume Weighted Average Price Signals
The signals from the VWAP could be confusing at some point. The reason for this is that the same signal from the indicator could be interpreted in two different ways.
VWAP Breakout
When the price goes above the VWAP indicator this means that the strength of the bullish move is strong. It is so strong that the price has managed to break its average value on the chart. Therefore, we get a long signal. The same is in force for a bearish breakout, but in the opposite direction.
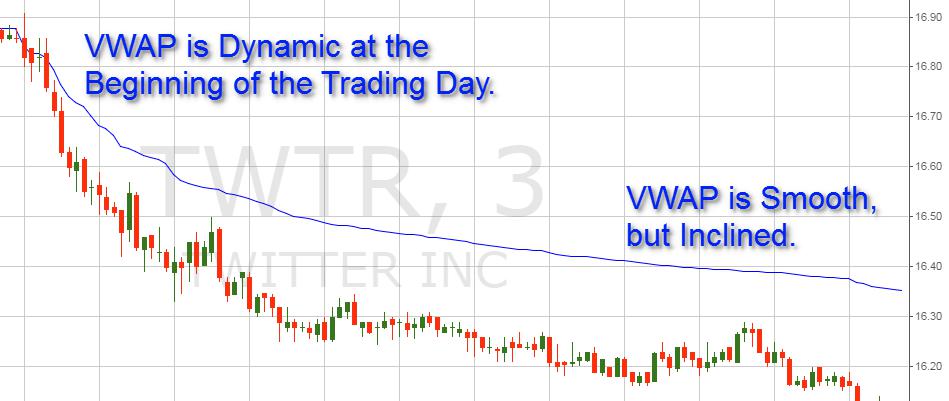
At the same time, if at the end of the trading day the VWAP is smooth, but visibly inclined, this speaks of a strong trend. Have a look at the image below:
The trading day starts with the usual VWAP dynamics due to the initial short amount of periods. Later in the day the indicator is already smooth, but still inclined downwards. This means the trend is very strong.
Support and Resistance with the VWAP
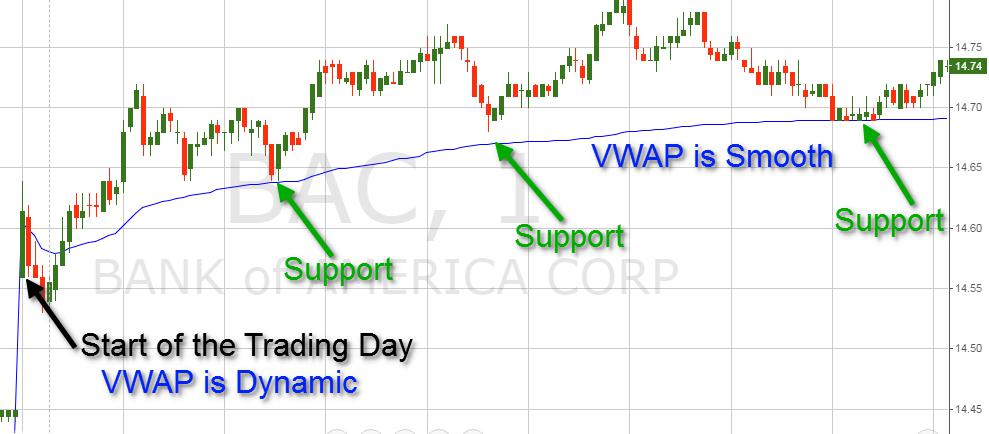
The Volume Weighted Average Price line could be used as a support or resistance for the price action. Since the indicator averages the total periods for the day, it has psychological meaning on the chart. If the price approaches the VWAP line from below and starts hesitating in the area, then the VWAP may be considered resistance. If this happens in the opposite direction, then the indicator might be able to support the price, creating a bullish bounce. Below you will see an example of the VWAP as an effective support:
Price Way above the VWAP Line
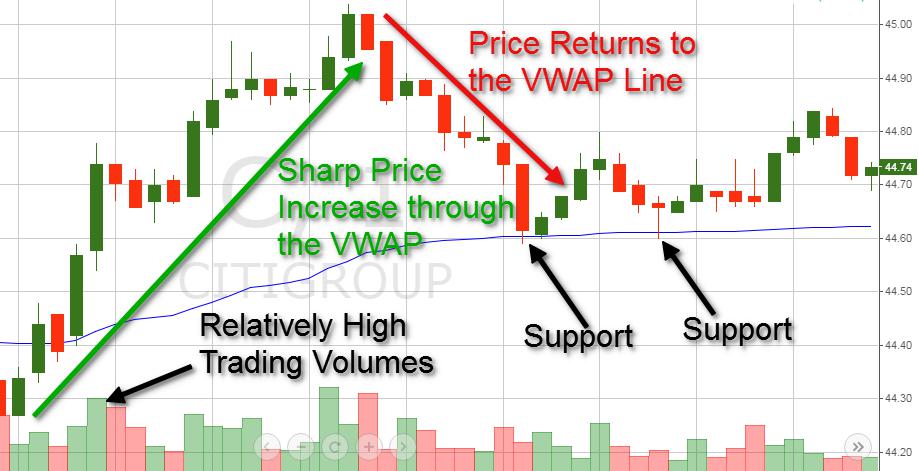
If the price increases a lot after a bullish breakout through the VWAP, this could have a different meaning. If the price goes way above the VWAP – yes it means that the bullish trend is very strong. However, if this happens for a short period of time, it also means that the price is way above its average value and it might be time for a decrease. The same is in force for bearish breakouts but in the opposite direction. This acts the same way as the overbought/oversold signals from the oscillators.
On the image above we observe a sharp price increase through the VWAP line for a short period of time. At the same time, the trading volumes are relatively high, indicating that this might be the reason for the increase. The price goes way too high, and then it drops to the VWAP for less than 10 minutes to test the line as a support.
Just remember: Buying way below the VWAP may be considered a good deal since the price is way below the daily average (make sure to understand the cause of the move). Selling way above the VWAP is also considered a good deal, since the price is way above its daily average.
Trading with the Volume Weighted Average Price
The VWAP is a good tool for measuring relative strength, however like many market signals, you may want to combine it other technical indicators for confirmation.
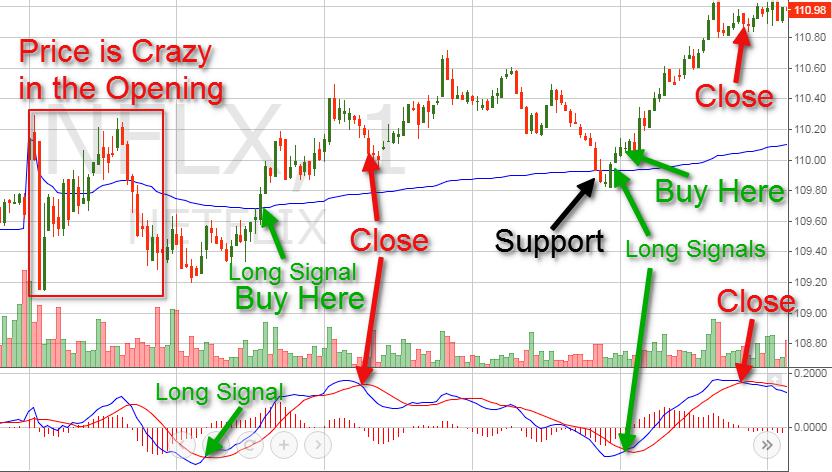
In this manner, we will now demonstrate you a VWAP trading strategy which works. We will combine the indicator with another lagging indicator – the Moving Average Convergence Divergence (MACD). We will enter trades only based on matching signals from both indicators. We will close our trades when the MACD creates a crossover in the opposite direction. The image below will show you how this strategy works:
We skip the market opening, since the price is crazy due to very high trading volumes. We get our first signal when the MACD lines do a bullish crossover. Minutes later, the price switches above the VWAP line. We match two long signals from the indicators and we buy! We stay in the trade until we get an opposite MACD crossover 30 periods later.
The price then decreases to the VWAP line and tests it as a support. The line sustains the price action and we get a bullish VWAP breakout. Couple periods later, the MACD does a bullish crossover and we get our two long signals. We buy and we stay in the trade for 25 periods until the MACD gives us a bearish crossover.
These two trades would have generated a profit equal to 1.04% for less than an hour.
In Summary
VWAP is a great technical indicator because it accounts for both price AND volume. Unlike moving averages, VWAP assigns more weight to price points with high volume. This allows you to understand price points of interest, gauge relative strength, and identify prime entries/exits.


