

What is Stock Volume
The stock volume measures the amount of trading put into a financial asset. The volume simply reflects the amount of shares traded for a given period. If the trading volume is high, then the stock is currently highly traded. On the contrary, if the volume of the equity is low, then the stock is not highly traded at for the given time period.
In this manner, the more popular a stock is, the higher the trading volume.
Stock Liquidity
Liquidity refers to how easy it is to buy and sell a stock. As day traders, it is important to trade liquid stocks so you can get in and out of positions without any trouble. In order to be liquid, a stock needs to have a lot of trading activity. This is associated with high trading volumes. When volumes are high, this means that the stock involves more market players than usual. Buyers and sellers fight for dominance and one of the sides overpowers the other. This ongoing battle allows day traders to get in and out of positions with ease. High volume trading periods facilitate better trading opportunities.
Contrarily, if a stock is illiquid, it means there are less buyers/sellers interested in the stock so it can be harder to get in and out of trades.
Why High Volumes Attract Traders
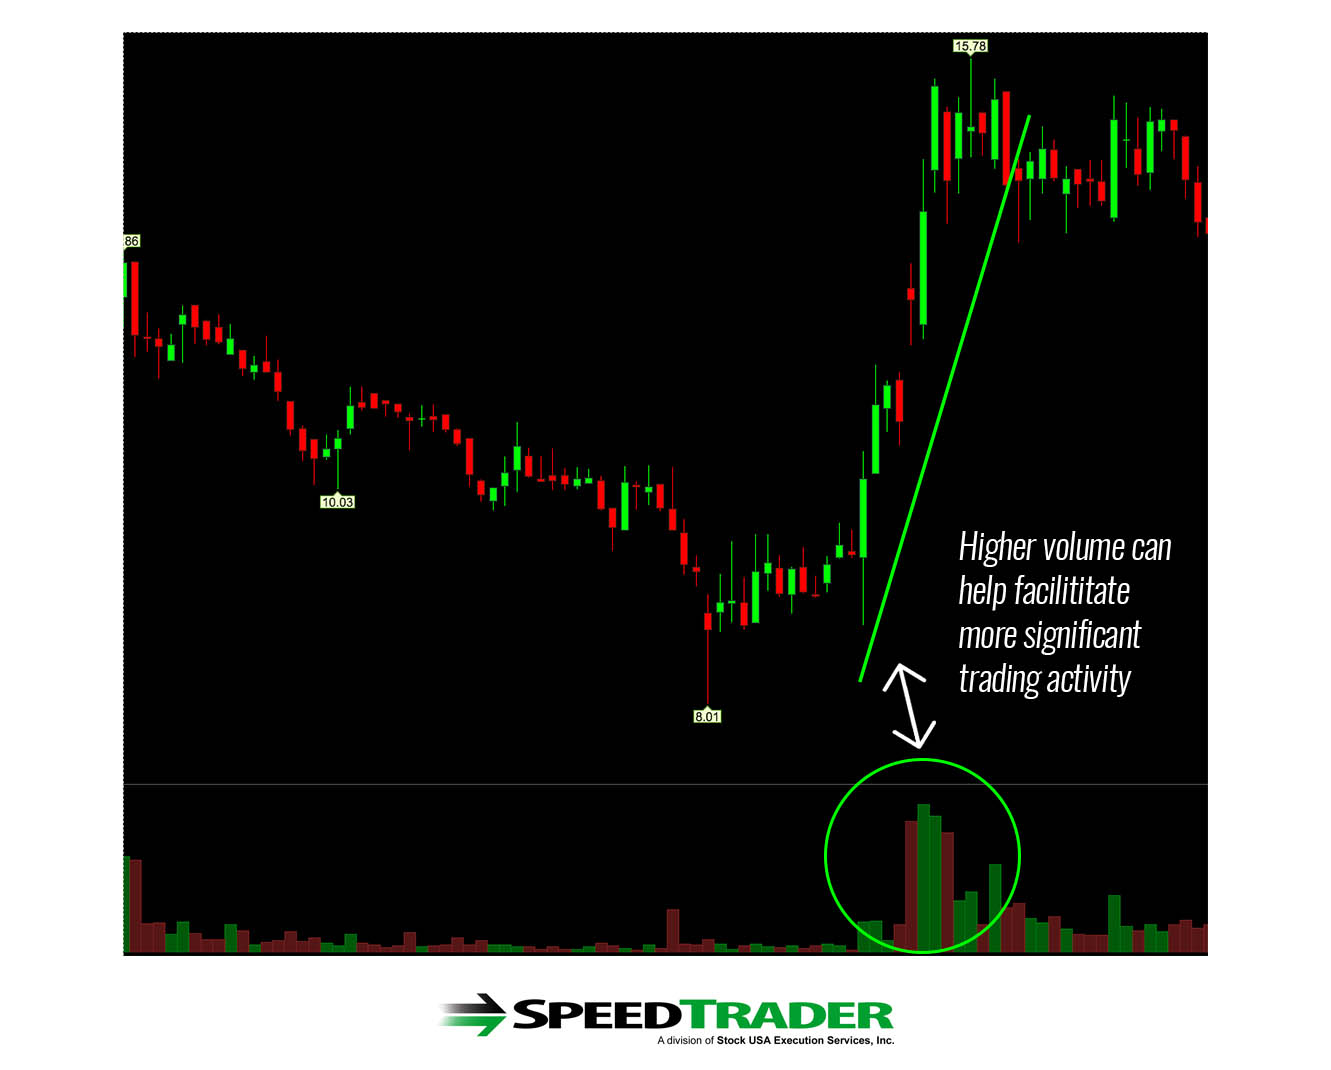
High volume is often associated with more appealing trading activity. For example, a stock may experience higher volatility with higher volume, or shift from a ranging period to a trending period due to the volume boost.
These periods of high volume reflect interest in a stock, meaning that more traders are trying to take positions. This high trading activity allows the stock to make bigger moves. Additionally, during these time periods, the stock can be more volatile.
As day traders, we are looking to take advantage of significant moves. We have no interest in stocks that are range-bound due to their limited trading activity. Stocks with higher volumes attract more traders due to the increased liquidity and significant price movement.
Relative Volume
The relative volume metric can help distinguish good trading conditions from less attractive ones. Simply said, you should look to trade stocks when the volume is relatively high. On the contrary, you should stay out of the market when trading volumes are low, because the stock is not likely to register a significant percentage change. But how can we find out the relative volume of a stock?
This happens with a simple Volume Indicator on the chart. Open the built-in tools of your trading platform and choose the “Volume Indicator”. When you do it, this is how your chart will look like:
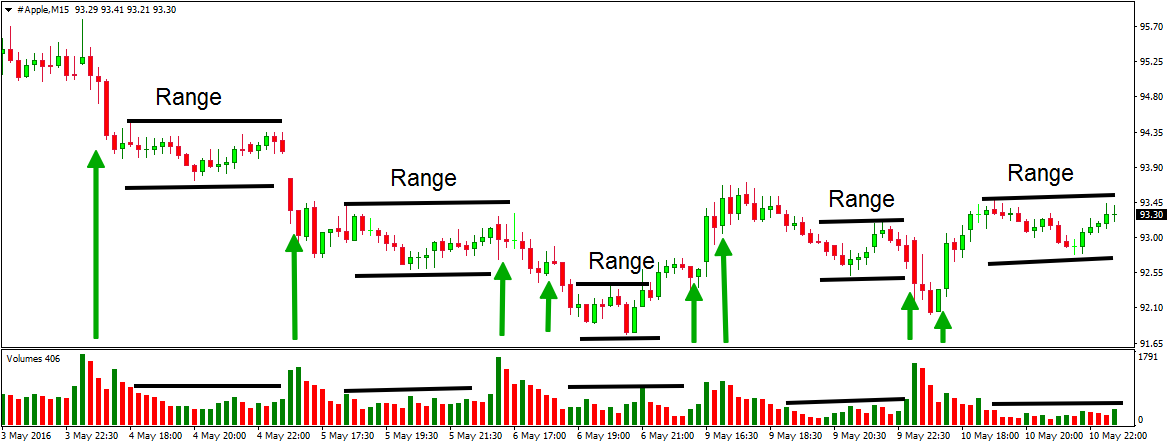
Above you see the 15-minute chart of Apple for May 3 – 10, 2016. At the bottom of the chart you see the Volume indicator, which shows the AAPL stock volumes.
Notice that when volumes are higher than usual, a bigger price move occurs on the chart (green arrows). Contrary to this, when volumes are low, we have a fat movement on the chart (black lines). In this manner, the ranges on the chart are associated with the relatively low trading volumes.
Having this in mind it is easy to conclude that it is better not to trade when trading volumes are low, because the liquidity is low too and there is an absence of a trending move. If you want to make some profit on the stock markets, you should concentrate your trading in situations with relatively high stock volumes.