
What is an accounting ratio?
Accounting ratios, also known as financial ratios, compare a single financial value to another value from a company’s operations to quickly derive a comparable metric. This metric can be used when analyzing a company’s financial statements. They allow for apples to apples comparison of the financial items that all businesses share, regardless of the type of business. These are common tools used in fundamental analysis.
Why is it used?
Investors can attain a better understanding of the company by using accounting ratios. They can help to derive and justifty a company’s valuation by comparing them to the industry ratios and specific peers. Ratios can be conveniently used to measure a company’s performance improvement or decline based on the past, current or future outlook.
Benchmarking
Benchmarks are the specific industry and sector standard ratios. Industry standards are the context in which accounting ratios can be used in comparing and constrasting a specific company. By comparing to the benchmarks, an investor can quickly conclude how the company ranks in terms of being over or undervalued with its peers. Investors can also compare a company’s accounting ratio against other industry benchmarks or against equity market benchmark indices like the S&P 500 or the Dow Jones Industrial Average. For example, if XYZ has a price/earnings ratio (P/E) of 9 compared to the industry average P/E of 18 and the S&P 500 index average P/E of 21, then the company may be undervalued.
Common Ratios and Statistics
Market Capitalizaton (Market Cap) is calculated by multiplying the current share price to the total number of oustanding shares. This value is dynamic, not static, since share prices will fluctuate during market hours. Market cap is often used to gauge the market value of a company and rank them accordingly within the sectors and industries. When XYZ is referred to as a $50 billion corporation, it is likely referring to the market cap.

Earnings Per Share (EPS) is calculated by dividing the net income (for the quarter or fiscal year) by the average number of outstanding shares. The EPS is one of the most important accounting ratios in terms of stock price reaction. Companies that exceed analyst’s consensus EPS estimates tend to see their share prices rise, while missing estimates results in falling share prices. More importantly, a company’s forward EPS guidance can make the most significant impact on the stock price. Although improving EPS implies that net income is growing, it may not always be the case. The EPS can grow sequentially by also shrinking the total outstanding shares through stock buyback programs. This is considered “financial engineering”, but pure cosmetic at best.

Price/Earnings (P/E) is calculated by dividing current share prices by the earnings per share (EPS). This popular accounting ratio is used to determine the profitbaility of the company and if share price is under or overvalued. The P/E of any specific stock can be compared to the industry average or directly with competitors. If XYZ has a P/E of 25 compared to ABC at a P/E of 12, then ABC may be a better value.
Price/Book (P/B) is calculated by dividing the current share price by the book value. The book value is total common shareholder’s equity divided by total number of shares. This ratio can help determine if the underlying stock is undervalued or overvalued. For example, if XYZ has a P/B of 2 compared to the industry average P/B of 6, then it may be undervalued.
Price/Sales (P/S) is calculated by dividing the current share price by total revenues. This is another ratio that can be used comparatively to determine if share prices are overbought or oversold. For example, if XYZ has a P/S of 5 compared to the industry average P/S of 2, then it may be overvalued.
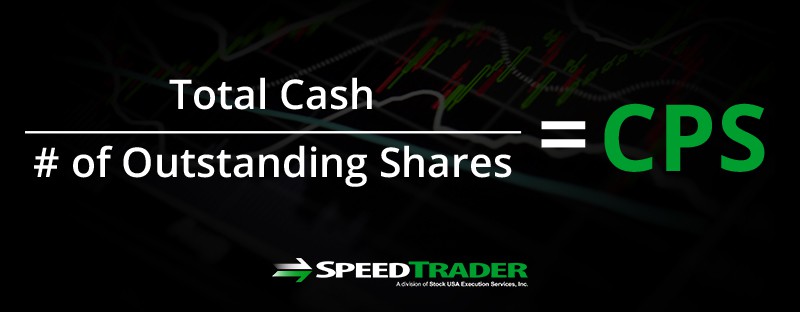
Cash Per Share (CPS) is the total cash divided by the total outstanding shares. The CPS is the most minimal value that a company may have (minus debt). If a company has CPS of $5 while the shares are trading at $6, it values the business at $1 per share. This may be a bargain, assuming there is little to no long-term debt. Stocks that trade under their CPS price are worth investigating for potential undervalued opportunities.
Insider Ownership is the percentage of the oustanding shares that are in the hands of company insiders including management, directors, executives and beneficial owners of 10% or more shares. Companies with high insider ownership have the perception that management has “skin in the game”.
Short Interest is the percentage of shares that are held short. The short interest is reported monthly. Stocks with high short interest north of 25% indicate a bearish sentiment. However, stocks with high short interest and a “thin” float under 10 million shares are prone to short squeezes. This is most common amongst speculative biotechnology, retail and technology stocks.