
No stock is the same and there are thousands of different chart patterns forming on a daily basis. In order to make sense of this overwhelming amount of data, it’s important to utilize pattern recognition techniques that allow you to summarize data and ease the decision-making process. Regardless of your trading style, it’s important to understand “the bigger picture” of the markets. Understanding “the bigger picture” can shine light on the strategies of other traders and help you identify price points of interest. This leads to the importance of understanding “The Stock Cycle.”
What It Is
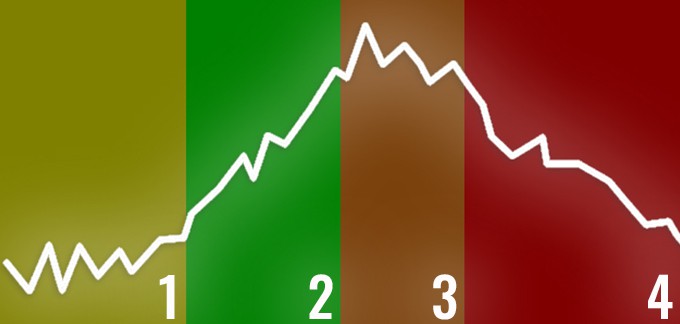
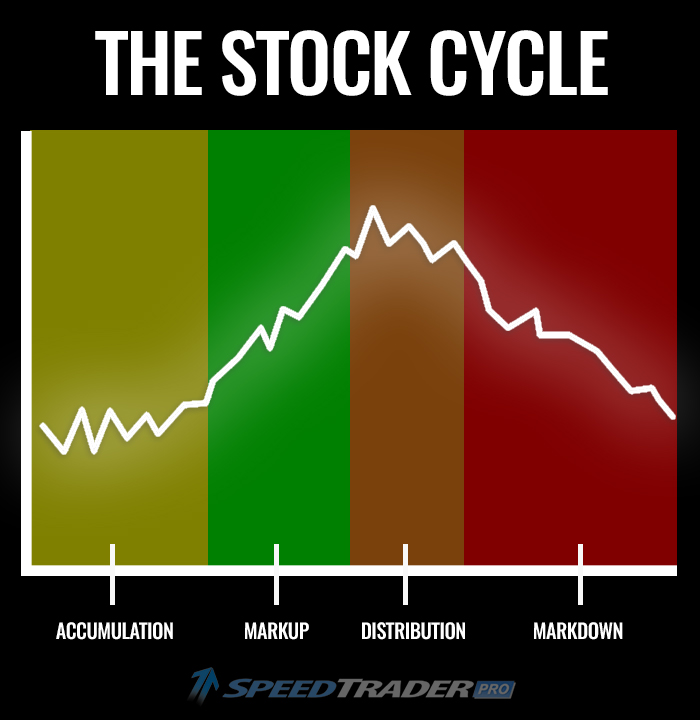
Most stocks rotate through phases, especially when influenced by institutional trading activity. This rotation, consisting of four key phases, is referred to as The Stock Cycle. There are a few ways to analyze these cycles – for the sake of this post, we’ll be focusing on the Wyckoff Market Cycle. The phases of The Stock Cycle include:
1. Accumulation
2. Markup
3. Distribution
4. Markdown
Why It Matters
Understanding the stock cycle can help you plan better entries and exits. This type of analysis is particularly useful for swing traders and investors who are planning to hold a stock for longer than a day, however it is applicable to all trend traders. Understanding which phase of the cycle a stock is in can help provide the insights necessary for predicting where the stock will go next.
Understanding the Phases of the Stock Cycle
Phase 1: Accumulation
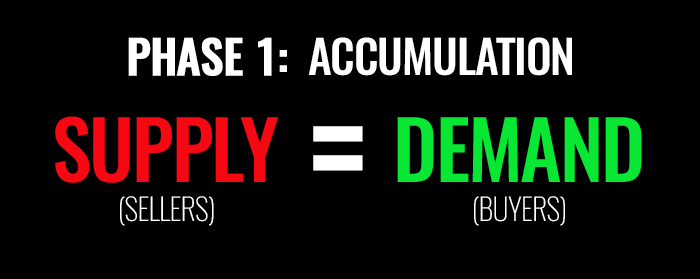
The first phase of stock cycle is accumulation. This phase usually follows a stock’s decline (or markdown phase). Accumulation occurs when interest starts building in a stock and buying volume comes in. Although buying interest is increasing at this point, the stock is still in a neutral trading phase, in which neither the bulls or the bears can overpower each other. During this period, a stock will trade sideways within a range of confirmed support and resistance levels.
When identifying stocks in the accumulation phase, the goal isn’t to trade them within that range. Instead, traders should be prepared to place a trade as the stock enters its markup phase.
Phase 2: Markup
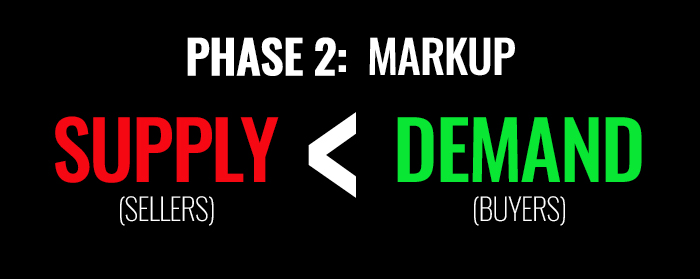
The markup phase follows the neutral, range-bound trading of the accumulation phase. This transition from accumulation to markup becomes evident as a stock starts setting higher lows, gaining volume, and frequently testing key levels of resistance. During the markup phase, a stock breaks out of its previous highs and continues to set new highs. Essentially, this marks the end of the ongoing battle between the bulls and bears, with the bulls prevailing. The stock should continue to set higher highs and higher lows in order to confirm the validity of this move.
At this point, the previously dull stock becomes of interest to all types of traders looking to profit from the upward momentum.
Phase 3: Distribution
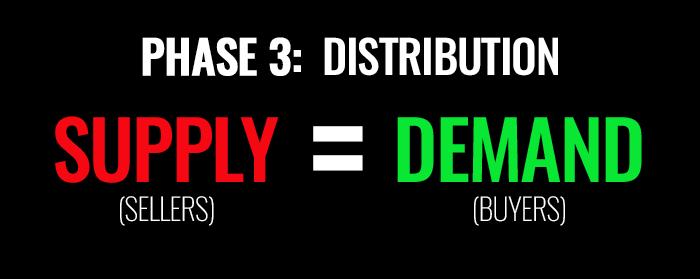
It would be naïve to assume a stock could go up forever without some sort of correction or pullback. When buying power from the markup phase becomes exhausted, the distribution phase begins. At this point, the amount of buyers begins to dwindle and more sellers enter the market. This starts to curb the upward momentum from the markup phase, shifting the stock into a neutral, range-bound trading area in which neither the bears nor the bulls are dominant. It’s important to note that this phase merely represents a period of indecision and does not necessarily allude to a move downward.
Often times, a stock’s volume will be higher in this phase as the bulls and bears battle it out. Unlike the markup phase, the distribution phase does not provide as many trading opportunities. Yes, there is higher volume, however the stock will be range-bound as indecision controls the market. This indecision may cause an increase in selling as institutions recognize the end of the markup phase and retail traders become less interested in the stock.
Phase 4: Markdown
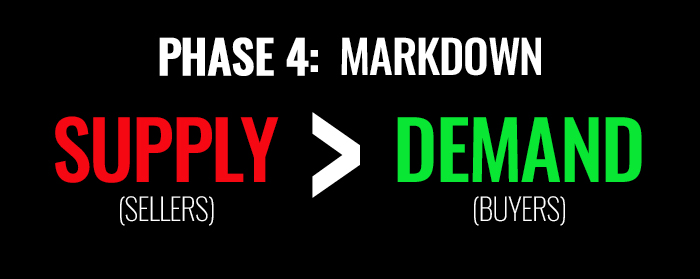
As mentioned above, the distribution phase is characterized by a decrease in buying volume. As buyers fail to support the upward move, sellers have the opportunity to become more aggressive. If a stock fails to hold the lows set in the distribution phase, it will begin to enter the markdown phase. This phase is characterized by lower lows and lower highs. At this point, the stock begins to enter a downtrend, providing a great opportunity for short sellers.
Eventually, the stock will find a bottom, the accumulation phase will be initiated, and the cycle will repeat itself.
How to Apply this Information
As with all day trading information, the main goal is to turn theories into actionable strategies. Understanding the stock cycle is a relatively easy way to analyze a stock chart. The main goal of this analysis is to find price points of interest so that you may plan profitable trades.
The main focus should be identifying price points at which a stock transitions from one phase to the next. Pinpointing a shift from the accumulation phase to the markup phase can provide a great long opportunity, whereas pinpointing a shift from the distribution phase to the markdown phase can provide a great short opportunity.
Planning these trades ahead of time can help you get better entries and exits. For example, if you find a stock in an accumulation phase, you may set an alert in your trading software for when the stock breaks above its resistance level. This allows you to enter a trade during the start of the breakout and set a safe stop at the previous resistance line (new support) in case of a false breakout.
There are plenty of different ways to utilize this data to improve your trading. Most importantly, understanding the stock cycle provides you with more clarity increases your awareness of “the bigger picture” of the markets