

What is Technical Analysis?
Technical analysis is a method of research that focuses specifically on only the price action of a stock or any other financial trading instrument or indices. By plotting the trades on a chart, traders are able to form a visual interpretation of the historical price action with the goal of forecasting potential price action moving forward. The assumption is that markets are not random but merely a game of dynamic supply and demand between buyers and sellers both trying to complete transactions without revealing their intentions. The ultimate goal is to spot transparency early enough to capture profits before it becomes too transparent at which point the opportunity to profit is diminished.
Less is More
Technical analysis is most effective when using just the right number of converging indicators to help support trading decisions. A common mistake is to use too many indicators, which can backfire and muddy analysis. The theme of less is more should be embraced when evaluating which indicators to utilize. Every indicator should serve a purpose that augments prudent and timely decision-making for the trader. As they say, “Keep It Simple Stupid” (KISS) applies here.
What Are Bollinger Bands?
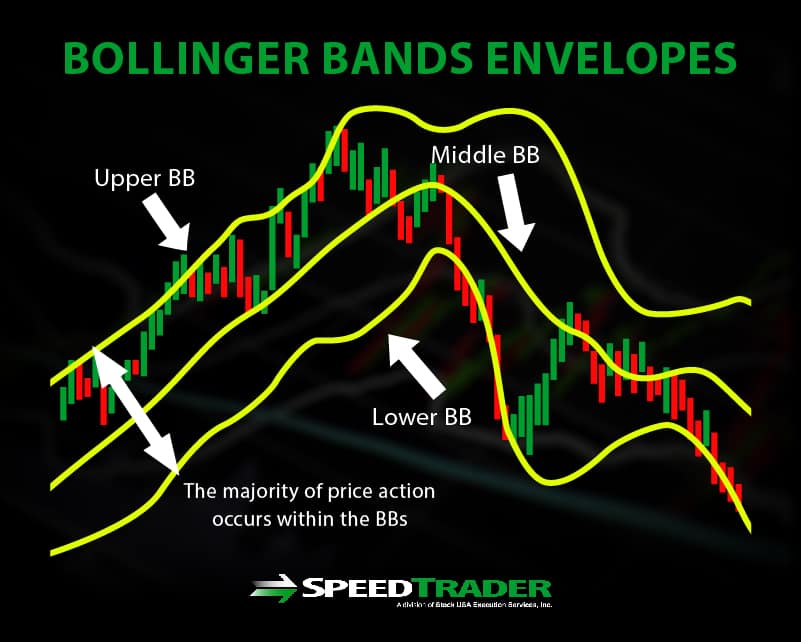
Bollinger Bands (BBs) are a technical analysis indicator developed by John Bollinger that tries to identify the nominal upper, middle and lower price range of the underlying stock price represented by three moving average “envelopes”. The middle envelope is usually a 20-period moving average and the upper and lower envelopes are calculated with a 2X standard deviation of the 20-period moving average. They visualize price volatility with potential inflection points at each envelope. The majority of price action occurs within the BBs. Most trading and charting platforms contain BBs. Here is the formula for calculating them:
Middle BB = 20-period moving average (MA)
Upper BB = 20-period MA + 20-day standard deviation x 2
Lower BB = 20-period MA – 20-day standard deviation x 2
The MA can be simple or exponential and the standard deviation can also be adjusted (IE: 20-period exponential MA and 2.618 standard deviation can accommodate high beta volatility with larger envelopes).
How to Use Bollinger Bands
Bollinger Bands can be used in any time frame to measure the nominal price range as well as potential support/resistance, trend and price inflection points where a reversal or extension can form. Traders can use this information to set-up potential trades at, towards or ahead of the inflection points.
Support/Resistance
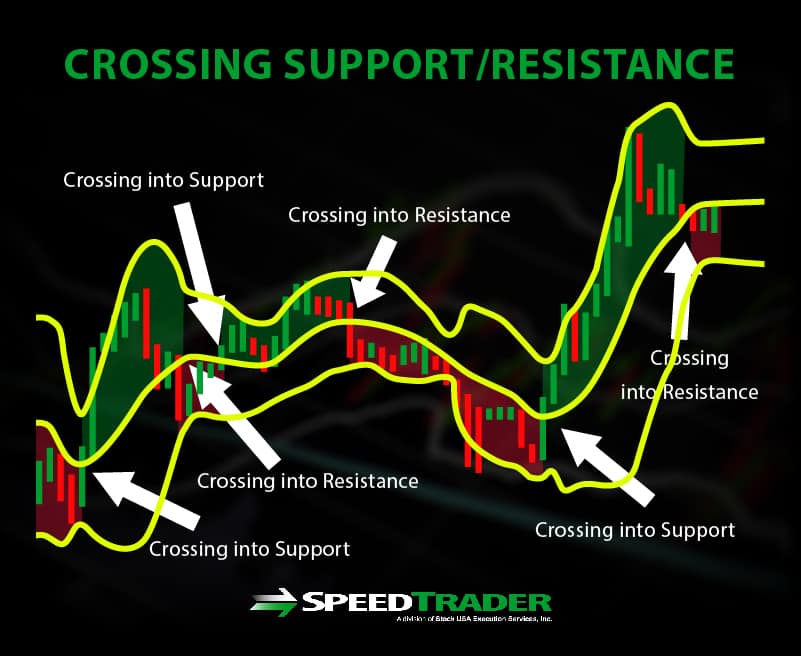
The middle BB is often used as a support/resistance price level. If the price is trading above the mid-BB, then it is a support. If the price is trading below the mid-BB, it represents a resistance. Usually, the price will attempt a minor deflection at the mid-BB before it either reverses or penetrates through that level representing a breakout or breakdown.
Breakouts and Breakdowns
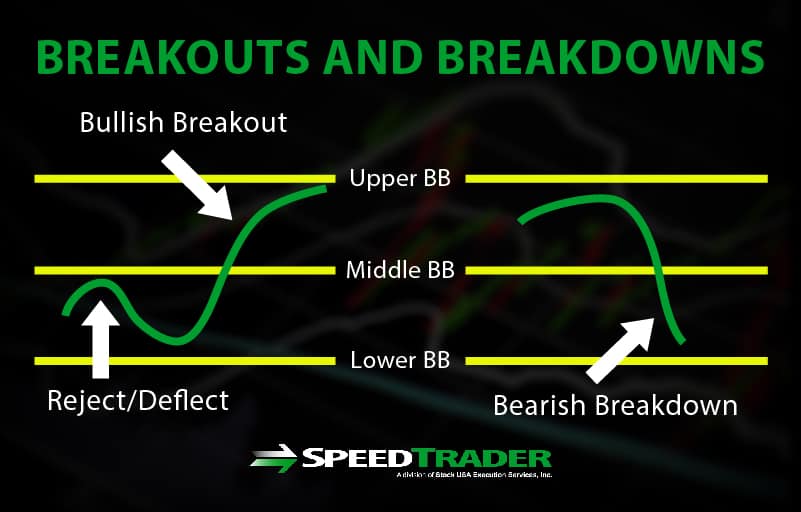
When the price approaches the mid-BB (20-period moving average), it will either reject/deflect or break through. When the price penetrates up through the mid-BB, it forms a bullish breakout and tends to move towards the upper BBs. When price falls down through the mid-BBs, it triggers a breakdown that usually moves towards the lower BB. Prices will always revert back to the mid-BBs where traders can then wait for a trigger to catch the next breakout or breakdown. However, too many traders make the mistake of jumping in ahead of the confirmation and end up either getting wiggled out constantly or trapped on the wrong side of the break. Therefore, it’s important to also monitor the constriction/compression and expansion of the upper and lower envelopes.
BB Compression or Expansion Period
Just like an EKG, BBs will contract and expand representing the ebb and flow of price action. When volume falls off, prices tend to chop around the mid-BBs as the upper and lower envelopes compress and tighten their range (distance between upper and lower BBs). This indicates a “calm” before the storm as both buyers and sellers play possum. During this period, the stock will still move, but the range is limited and each breakout or breakdown attempt soon fizzles out and reverts back to the mid-BB.
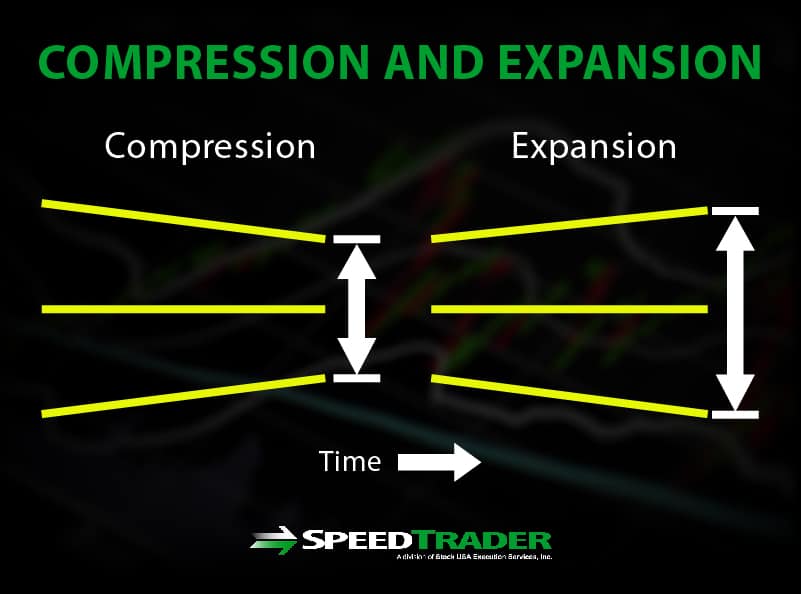
This is a very dangerous period because of the seemingly low volatility that makes traders complacent. Eventually, the steam builds and then BBs enter the expansion period where the price volatility increases with volume. Instead of the usually oscillation reversal at the envelopes, the price continues to grind and cause the BBs to expand while trapping oscillation traders that stepped in for a reversion trade kicking off a new uptrend or a short-squeeze or a downtrend on a price collapse.
Adding Momentum Indicators To Generate Trading Triggers
BBs are an excellent pricing tool when combined with converging momentum indicators. Pricing tools are like roadmaps that indicate where an inflection point lies on the chart. Pricing tools visualize trends, support/resistance levels and inflection points, which can act as triggers. Momentum tools like stochastic, MACD or RSI, serve as inflection points that can be used to time buy and sell triggers. Buy triggers can be set at lower BB reversal + stochastic 20-band cross up to target mid-BBs and/or upper-BBs. Sell/Short triggers can be set at upper-BB reversal + stochastic 80-band cross down to target mid-BB and/or lower-BBs.