What is Trend Reversal?
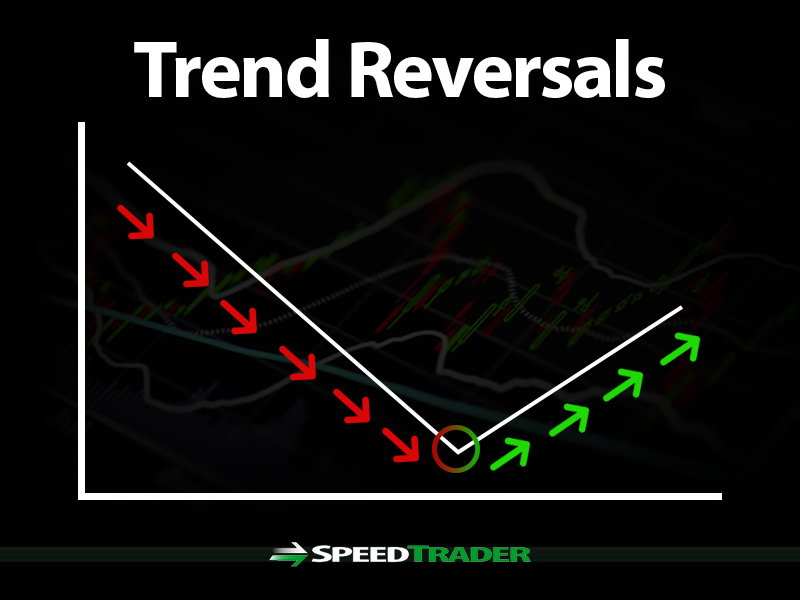
A trend reversal occurs when the direction of a stock (or any financial trading instrument) changes and moves back in the opposite direction. Up trends that reverse into downtrends and downtrends that reverse into up trends are examples of trend reversals.
Bullish/Bearish Trend Reversal
An up trend is bullish price action continues to make sequential higher highs and higher lows. A bullish reversal forms when the stock ceases making higher highs and starts to make lower highs and lower lows thereby reversing the direction from up to down. A bearish trend reversal follows the same lines inversely. A downtrend is bearish price action whereby the stock makes lower highs and lower lows. Each bounce attempt gets sold forming the lower high and each prior low gets sold harder to make lower lows. When the price stops making lower lows and establishes a higher low and continues to rise with higher highs and higher lows, it has formed a bearish trend reversal.
Trends Reversals on Different Time Frames
When measuring the high and lows, they can vary depending on which time frame chart is being used. A lower high and lower low series downtrend may be established on the 60-minute chart but the 5-minute chart may be showing an up trend with higher highs and higher low candlestick closes. In general, longer time frames indicate the general lasting trends but the shorter time frames can form countertrend moves back to the longer time frame resistance and either revert back down or continue to bounce for an early trend reversal attempt. It is very important to define the specific time frame you are trading and also understand whether it is aligned with a wider time frame trend. Shorter time frames are the 15-minute, 5-minute and 1-minute charts. Longer time frames are used with the 60-minute, daily, weekly and monthly charts.
Spotting Trend Reversals
Trend reversals represent the sentiment change in the underlying stock. Up trends that reverse into downtrends indicate profit taking often from overbought price levels. Downtrends that reverse into up trends indicate a sentiment change to bullish as buyers lift bids and reverse back into a bullish trend.
Why It’s Important
The important of spotting trend reversals is two-fold. First, it allows for timely exits of positions to protect profits or stem losses. Secondly, it gives the trader an opportunity to profit from trading in the opposite direction when the trend reversal forms.
How to Trade Trend Reversals
Trend reversals can be traded at varying points in the reversal process.
When trading reversals, it is important to maintain trailing stops in the event the reversal turns out to be a headfake. Reversals tend to start as wiggles or reversions that fail to bounce and eventually reverses the trend. The point of reversal is the break as it breakout or breakdown. Then the opposing trend follows afterwards. An up trend will eventually peak. As it tries to bounce again, it is met with stronger selling pressure producing lower highs and lower lows to eventually collapse support with a breakdown and the downtrend forms.
Anticipation Versus Confirmation
There is always a fine line between anticipating the reversal and getting a confirmation. Anticipating can get you an earlier entry on the reversal for a larger profit gain but the risk of getting faked out remains, which can result in a stop loss. Entering the trade on a confirmation can result in chasing the entry too far resulting in a minimal profit and still a possibility of getting stopped low on the reversion. The game plan can be sound but the results lie in proper execution of the trade. Usually, it is best to await the confirmation, and then wait for the first reversion attempt to step into the trade near the reversal support area. Patterns like a golden cross tend to give enough time to enter the trade when the stock attempts to re-test the 50-period moving average after it has crossed through the 200-period moving average. Traders can step in long on the initial reversion to the 50-period moving average for the bounce. There are many methods to confirm the trend reversal.
Method 1: Trend Lines
Trend lines are a common method of visually spotting trends and reversals. These involved some extra effort by drawing the trend lines ahead of time and require active monitoring.
How to Draw Trend Lines
To draw a trend line, start with the highest high of the specific chart and connect to the lowest high to form the upper trend line. To draw the lower trend line, start with the lowest low and connect to the highest low. It’s important to try to get sequential high/lows to connect to the trend lines to establish a more consistent trend and range.
Important Elements of a Trend Line
The distance between the upper and lower trend lines represent the channel. Expanding trend lines with higher highs and higher lows is an up trend, whereas lower highs and lower lows indicated with both trend lines falling diagonally, indicate a downtrend.
How to Spot Trend Reversals
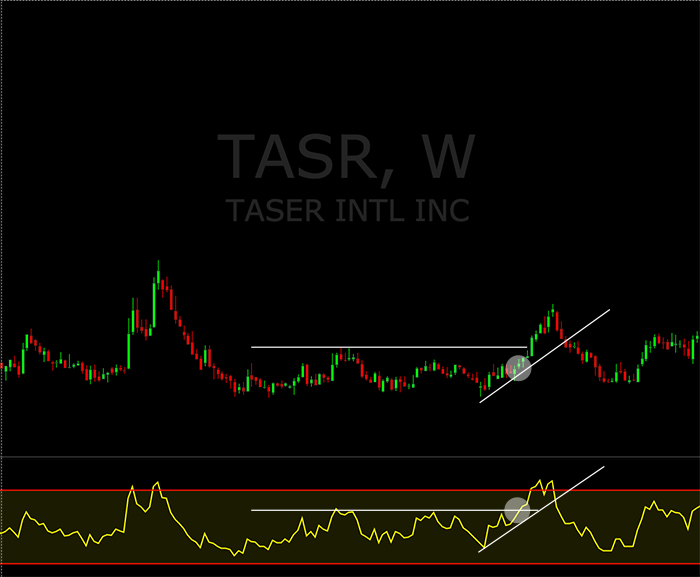
Trend lines may be diagonal or horizontal. When both trend lines are moving up or down together diagonally, then they are in an active up trend/downtrend. The trend reversal forms when the opposing trend line of the trend gets breached and then followed by higher highs and higher lows for a downtrend reversal into a breakout and lower highs and lower lows for a up trend reversal into a breakdown.
When both trend lines are horizontal then it represents a consolidation that will eventually for a breakout or breakdown. When the upper trend line is sideways with a diagonal rising lower trend line, then a potential ascending triangle breakout is forming. When the lower trend line is horizontal with upper trend line falling diagonally, it represents a descending triangle for a potential breakdown. When both upper and lower trend lines are moving in opposite diagonal directions forming an apex, then a potential symmetrical triangle or wedge is forming.
Method 2: Moving Averages
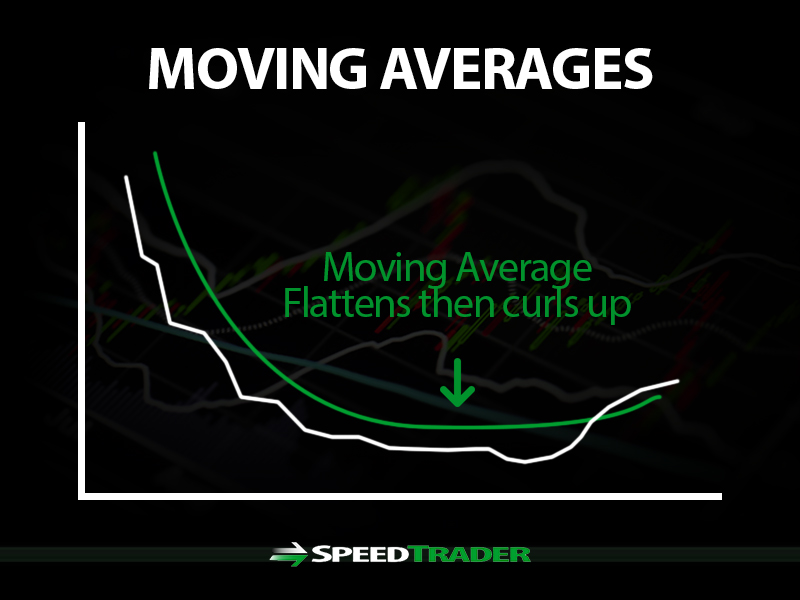
Moving averages are one of the most popular indicators to track trends. Usually a combination of two moving averages are used, a lead and a laggard (IE: 5-period and 15-period moving average). When the lead crossed through the laggard up or down, they form a breakout or breakdown and follows with an up trend or downtrend, respectively. The larger the moving averages, the more firmly the trend forms with fewer wiggles.
Significant Moving Averages
The most commonly used moving average combination is the 50-period and the 200-period. These are the components of the bullish golden cross breakout, which forms when the 50-period moving average crosses up through the 200-period moving average. The bearish death cross breakdown forms when the 50-period moving average crosses down through the 200-period moving average creating a downtrend. Shorter time frames like the 5-period and 15-period are commonly used intra-day.
Method 3: VWAP
The volume weighted moving average (VWAP) is a single moving average that represents the prices where the most volume has been traded that day. It is usually followed on an intra-day basis. Institutions use the VWAP as a measure of how well their orders were filled relative to the market. Traders can use the VWAP as a single support or resistance line and a measure of the trend throughout the day. If a stock moves above a declining VWAP, then it may be indicating a trend reversal. Usually this is confirmed on the pullbacks which then deflecting back up off the VWAP as it turns up and vice versa on up trend reversals when a stock falls below VWAP and then rejects bounces attempts at the VWAP line as it starts to decline indicating an up trend reversal turning into a downtrend.
Method 4: Long Term Chart Patterns
Some of the more popular long-term patterns are formed gradually and involve a bottoming process or a series of multiple reversal attempts.
Cup and Handle Pattern
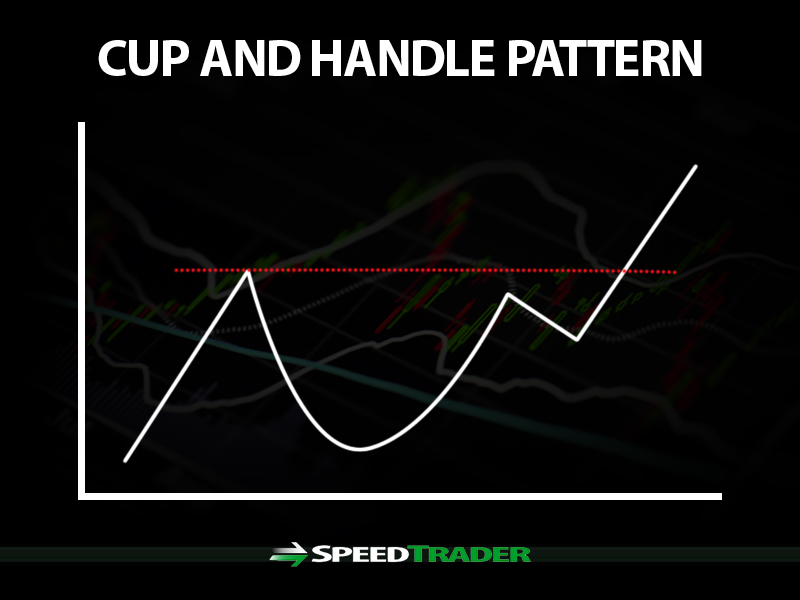
A bullish cup and handle forms when a stock forms a strong sell-off from a peak, the lip. Eventually the price forms a rounding bottom meaning there are no sharp bounces but a gradual series of higher lows and lower highs that forms a base and consolidation. Eventually the reversal forms slowly as the stock rises back up towards the lip area. This forms a U shape, the cup. The stock will re-test the lip and reverse back down again in a slow diagonal movement, the handle. Then the stock rallies hard back up through the upper trend line, this time it breaks through the prior highs (the lip) and squeezes higher for the next leg on the up trend.
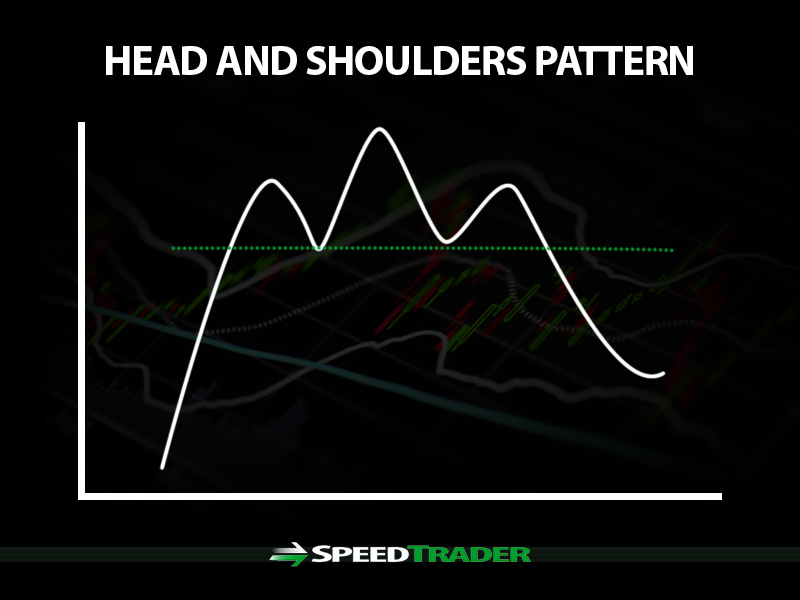
Head and Shoulders Pattern
A bearish head and shoulders pattern forms after making an initial high followed by a pullback forming the first shoulder. The low of the pullback starts the trend line. The stock then manages to move higher through the prior high to form a new high before peaking, this is the head. The stock pulls back and then bounces again. The low of the bounce area is the shoulder line where the trend line should be connected. This bounce only musters a partial rally that fails to surpass the high of the head area. When the stock peaks out, it forms the second shoulder. As the stock reverses back down, the shoulder trend line is the key spot to watch. If the trend line breaks, then it triggers the head and shoulders pattern whereby the buyers have lost momentum and profit takers and short-sellers take over causing the stock to collapse on trend reversal into a downtrend.


