What is Stock Volume The stock volume measures the amount of trading put into a financial asset. The volume simply reflects the amount of shares traded for a given period. If the trading volume is high, then the stock is currently highly traded. On the contrary, if...
If you are a fan of trading indicators, then the following material will suit you. Today we are going to introduce you an indicator which takes into consideration price and volume. Behold the mighty Volume Weighted Average Price (VWAP) indicator! What is the Volume...
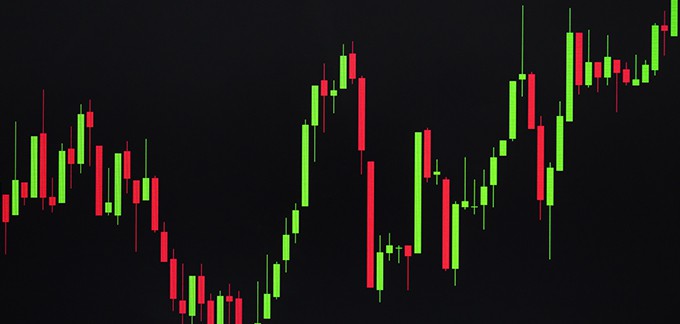
Candlestick patterns are special on-chart candle formations, which hint at potential price outcomes. They can be found on the chart of any financial instrument – Forex, Stocks, Commodities, Indices, etc. Therefore, traders carefully follow every candle on the chart...
As part of our “Technical Indicators Explained” series, we are focused on breaking down some of the more commonly used technical indicators that may be beneficial to your trading. There is an endless supply of different technical indicators and you should not attempt...
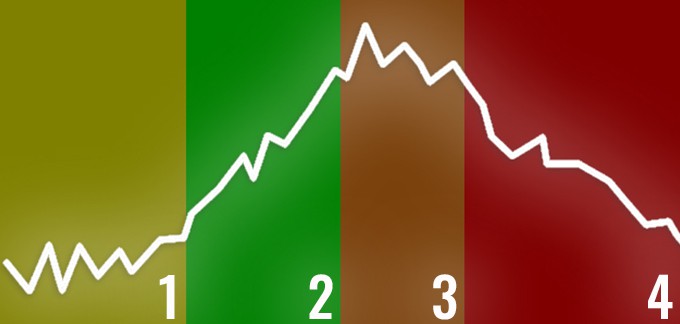
No stock is the same and there are thousands of different chart patterns forming on a daily basis. In order to make sense of this overwhelming amount of data, it’s important to utilize pattern recognition techniques that allow you to summarize data and ease the...
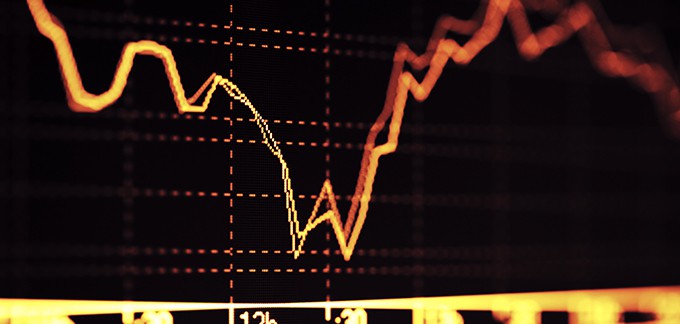
Being a successful day trader is all about being able to predict a stock’s future price action. If you go long a stock, you’re betting that the stock will go up. If you short a stock, you’re betting the stock will go down. The strategies that go into this decision...